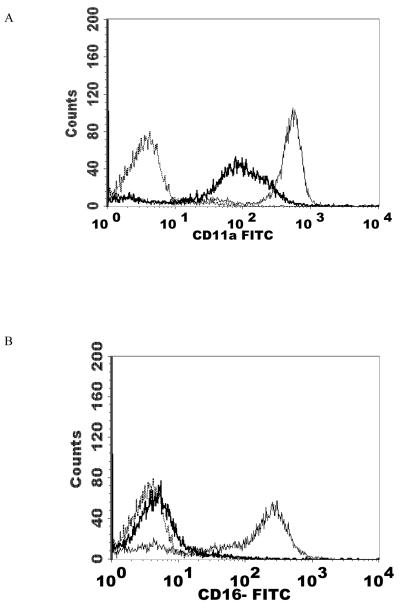
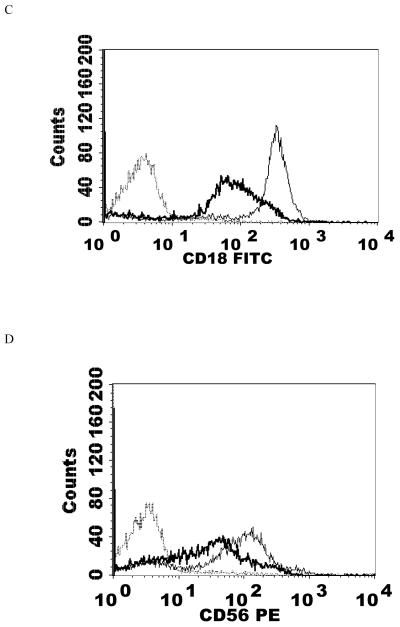
Figure 3.
Effects of a 1 h exposure to 2.5 nM PMA followed by 24 h in PMA-free media on NK cell-surface protein expression A) CD11a. Dashed line = IgG isotype control, thin solid line = control NK cells, bold line = PMA treated cells, y-axis is cell number, and the x-axis is fluorescence intensity. B) CD16. C) CD18 . D) CD56. Results were replicated in NK cells prepared from 5 separate donors, n=5.


