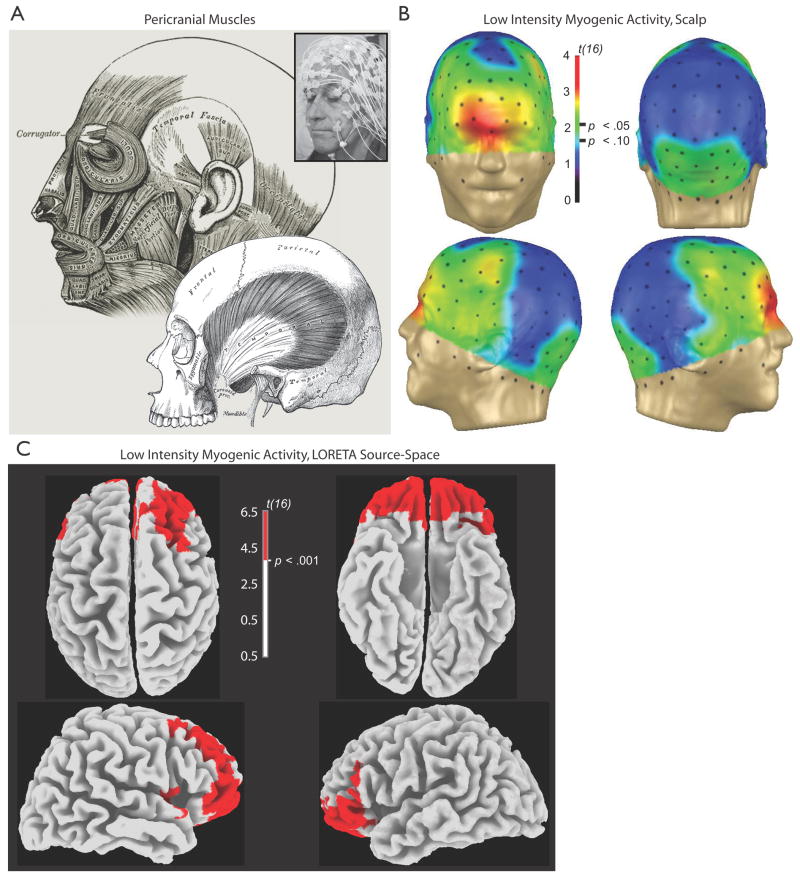
Figure 1. Myogenic activity.
A. Cranial muscles. Nearly all cephalic electrodes lie atop or adjacent to muscle, making EMG artifact a concern for the entire head—not just anterior electrodes. Key generators of myogenic artifact include the corrugator along the brow, orbicularis oculi around the eyes, frontalis above the brow, masseter on the jaw, the peri-auricular muscles surrounding the ear, and occipitalis at the base of the skull. Lower engraving depicts temporalis. Inset shows the 128-channel EEG array. Engravings adapted from Gray’s Anatomy (Gray, 1918/2000). B. Low intensity myogenic activity on the scalp. Spline-interpolated topographic plots of the thresholded myogenic contrast (Tense minus Relaxed, Eyes Open; n = 17). One-third of the 128-channel array reached threshold (p = .05) and one-half showed trends (p = .10). C. Low intensity myogenic activity increased activity in large regions of the cerebral source-space. Images depict the thresholded myogenic contrast. Note the absence of suprathreshold voxels in primary motor cortex (M1; precentral gyrus). Data were modeled using LORETA, as detailed in McMenamin. Additional images are presented in the Supplement to McMenamin.

