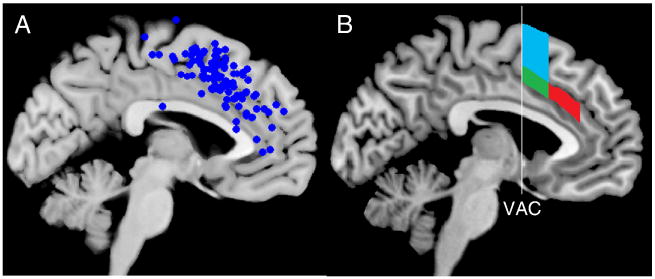
Figure 1.
A) Plot of 110 peaks from 43 studies examining response conflict (adapted from (Nee et al., 2007). Clustering is evident in RCZp, as well as the pre-SMA. B) Zones corresponding to RCZa (red), RCZp (green), and the pre-SMA (cyan) as described by Picard and Strick (2001). VAC – vertical anterior commissure line.

