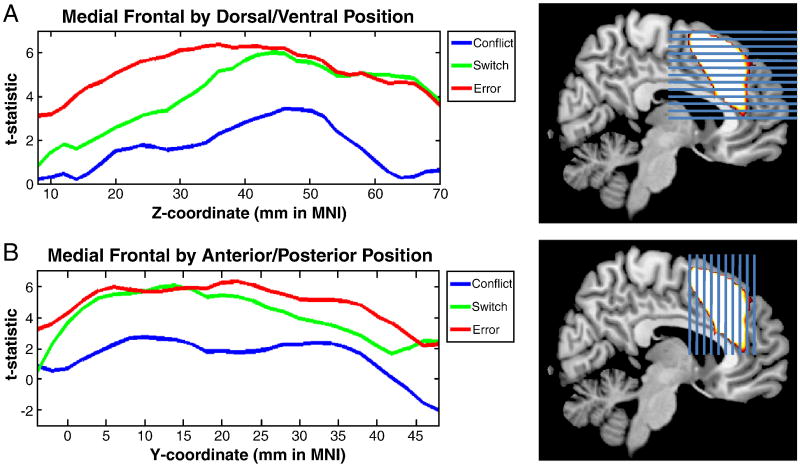
Figure 5.
Activations by position in the mPFC. First, an ROI was defined that combined Conflict, Task-Switching, and Error-related activations. Next, this ROI was sliced horizontally through the z-plane (A, left) and vertically through the y-plane (B, left). Within each slice, the average t-statistic was computed separately for Conflict (blue), Switching (green), and Error (red) contrasts. In ventral and anterior regions of the mPFC ROI, Error-related activation dominated. In dorsal and posterior regions, Errors and Switching were equivalent. Conflict-related activation was less strong than both Switching and Error-related activation throughout.

