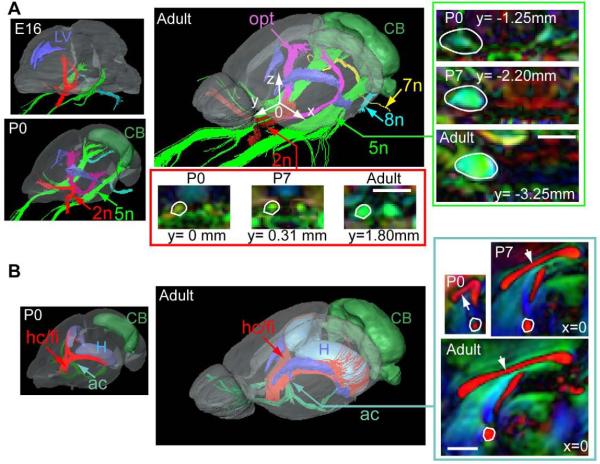
Figure 2.
Development of the cranial nerves and commissural tracts in the mouse brain. At each stage,single subject images from the brain specimen with the median total brain volume was shown. A) The trigeminal nerve (5n, green), facial nerve (7n, yellow), vestibulocochlear nerve (8n, light blue), optic nerve (red), and optic tracts (purple), together with the lateral ventricles (LV, blue) and cerebellum (CB, green). To facilitate comparison between different specimens, we define the mid-sagittal anterior commissure as the origin, with the X, Y, and Z axes along the left-right, anterior-posterior, superior-inferior axes as shown by the white arrows in the 3D rendering of the adult mouse brain. Time-related changes in cross-sectional areas of the 5th nerves and optic nerves are examined in coronal sections (inside the green and red boxes, respectively). The locations of the coronal sections along the Y axis (anterior-posterior) are marked under each image, and also indicated by the green and red arrows in the 3D images. B) The anterior commissure (ac, green), hippocampal commissure and fimbria (hc/fi, red), with the lateral ventricles (blue), hippocampus (H, light blue), and cerebellum (CB, green) in P0 and adult mouse brains. The white arrows indicate the corpus callosum. Time-related changes in cross-sectional areas of the commissural fibers are examined at the mid-sagittal level. No embryonic data are shown in panel B because commissural and cerebellar tracts were not visible in MR images until late embryonic stages. The locations of the sagittal sections along the X axis (the left-right axis, x=0 for the mid-sagittal section) are indicated by the dark green arrows in the 3D images Scale bars = 1 mm.

