
Figure 1.
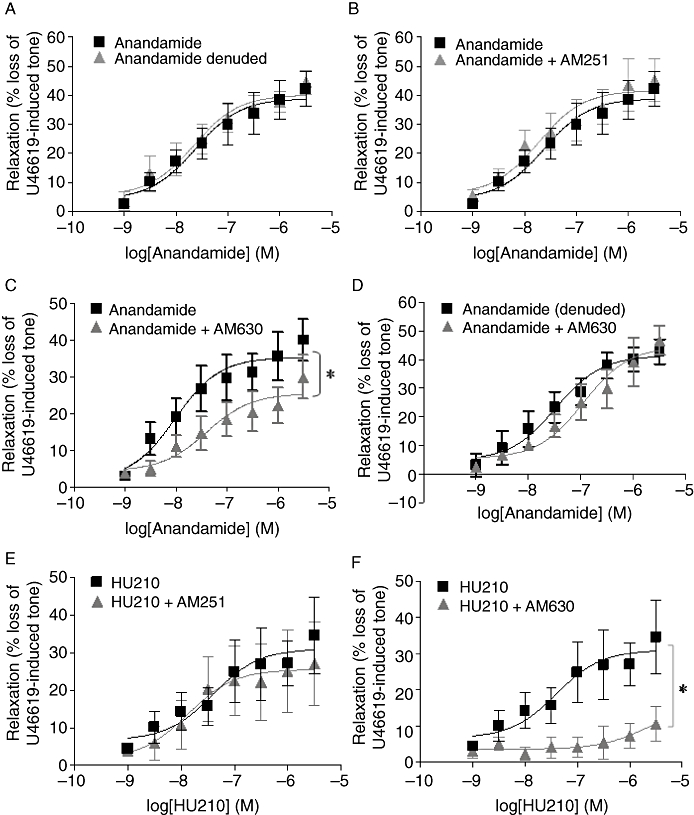
Anandamide induced vascular relaxation via the CB2 receptor. Concentration–response curves for the vasorelaxant effect of anandamide (1 nM–30 µM) in (A) endothelium-intact (n= 13) and endothelium-denuded (n= 7) rat CA and concentration–response curves for the relaxation of U46619-induced tone in endothelium-intact rat CA for anandamide (1 nM–30 µM) in the presence of (B) AM251, a selective CB1 antagonist (10 µM) (n= 6) (C) AM630, a selective CB2 antagonist (100 nM) (n= 5) and (D) AM630 (100 nM) (n= 4) in endothelium-denuded rat CA. (E) Concentration–response curves showing the vasorelaxant effect of HU210 alone (1 nM–30 µM) and in the presence of AM251 (10 µM) (n= 6) and (F) in the presence of AM630 (10 µM) (n= 4). Data are expressed as a percentage of U46619-induced tone and shown as mean ± SEM for n arteries from different animals. *P < 0.05 versus anandamide alone as determined by two-way anova.