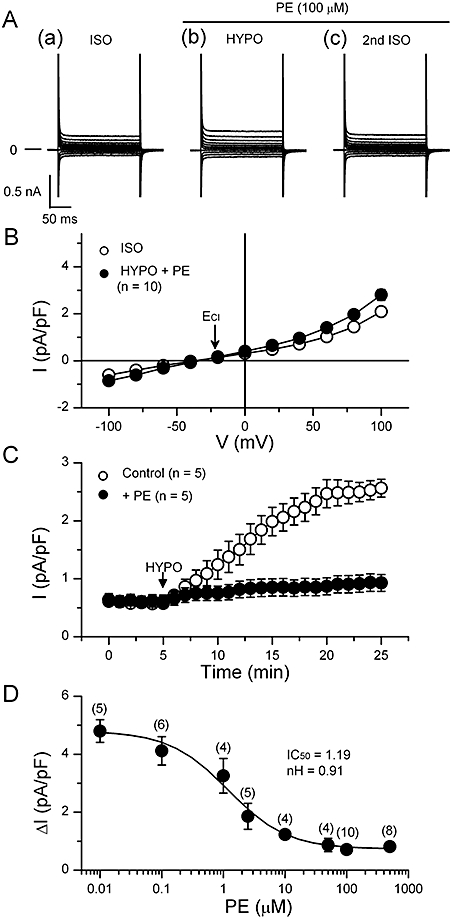
Figure 3.

Suppression of the hypotonic activation of volume-regulated anion channel (VRAC) current by phenylephrine in mouse ventricular cells. (A) shows representative records of the currents elicited by the voltage protocol illustrated in Figure 1. Phenylephrine (PE; 100 µM) was present in hypotonic solution (HYPO) and 2nd isotonic solution (ISO). (B) The mean I-V relationships of the currents obtained in ISO and in HYPO with PE (n= 10). The arrow indicates the predicted ECl (−21 mV). (C) Time course of activation of VRAC currents recorded in the absence (open circles) and presence (closed circles) of 100 µM PE. The whole cell current was recorded at +40 mV, while 400 ms voltage steps to +40 mV were applied to the cell from a holding potential of −40 mV every 6 s. Data obtained from five different cells were averaged for each curve. The bath solution was changed from ISO to HYPO at arrow. (D) Concentration dependence of the inhibitory effect of PE on the activation of VRAC current. Hypotonicity-induced (difference) currents (ΔI) at +100 mV are plotted for various PE concentrations. Each point represents mean of data obtained in several different cells, and the curve was obtained by fitting the data points to the Hill equation, yielding IC50 and Hill coefficient (nH) as shown.
