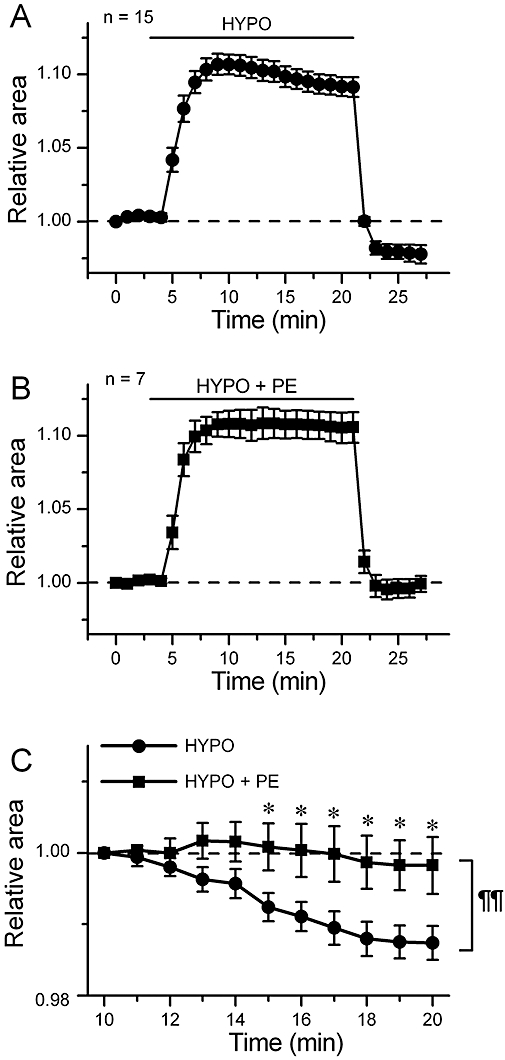
Figure 4.

Inhibition of cell volume regulation by phenylephrine (PE). (A) and (B), time course of change of the relative cell area in cells exposed to hypotonic solution (HYPO) in the absence (A, n= 15) and presence (B, n= 7) of 100 µM PE. The cells were initially bathed in isotonic solution (ISO), and then HYPO or HYPO + PE was applied during the period indicated by bar. (C) shows an expanded illustration of a part of A and a part of B. The values are expressed as relative to those obtained 5 min after application of HYPO. *, significantly larger than the time-matched HYPO data with P < 0.05 according to an unpaired t-test. A comparison of curves with repeated measures anova yielded P < 0.01 (¶¶).
