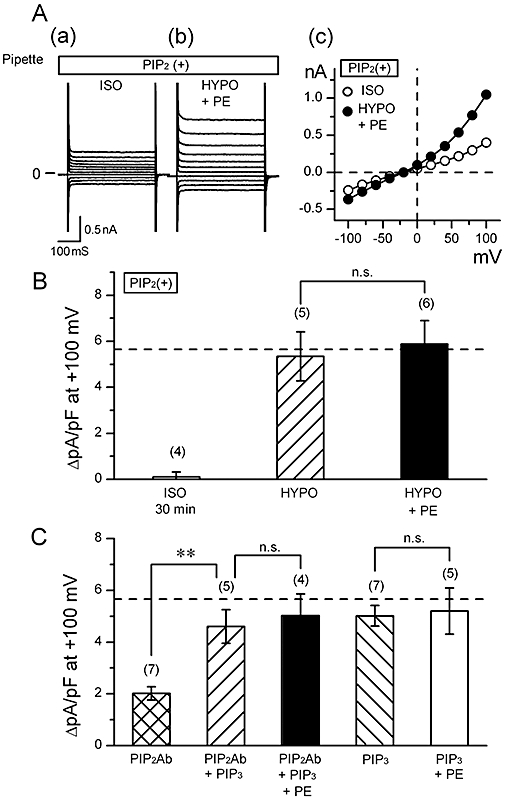
Figure 6.

Effect of phosphatidylinositides on phenylephrine (PE)-induced suppression of volume-regulated anion channel (VRAC current). (A) Raw current traces in response to various voltage steps (a and b) and the corresponding I-V relationships (c), obtained in a cell loaded with 10 µM PIP2. Data were obtained in isotonic solution (ISO; a) and hypotonic solution (HYPO) containing 100 µM PE (HYPO + PE; b). Currents were elicited by applying 400 ms voltage-clamp steps to membrane potentials between −100 and +100 mV in +20 mV steps from a holding potential of −40 mV every 2 s. (B) Mean density of hypotonicity-induced (difference) current at +100 mV obtained in cells dialyzed with 10 µM PIP2. Data were obtained in the absence (HYPO) and presence (HYPO + PE) of 100 µM PE. The difference between the current magnitudes observed 5 and 30 min after the beginning of whole cell recording under isotonic condition is also shown on the left (ISO 30 min). n.s., not significantly different. (C) Mean density of hypotonicity-induced (difference) current at +100 mV obtained in cells dialyzed with some phosphatidylinositide-related compounds. Three types of pipette solution were prepared; they contained anti-PIP2 antibody (PIP2Ab), PIP3, or both PIP2Ab and PIP3. PIP2Ab was added to the pipette solution at a 1:40 dilution, and PIP3, at a concentration of 10 µM. Some cells were extracellularly exposed to 100 µM PE (+PE). **, significantly different with P < 0.01. n.s., not significantly different. Dashed line in (B) and (C) indicates the control magnitude of VRAC current derived from the data in Figure 4A. Number in parentheses indicates number of the cells examined.
