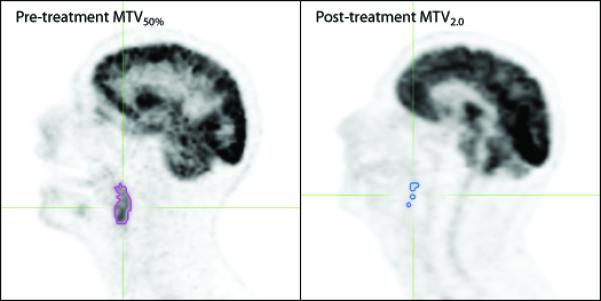
Figure 1.

Metabolic tumor volume on pre- (left) and post-treatment (right) PET images. The purple outline circumscribes the pre-treatment MTV50% (metabolic tumor volume with relative threshold of 50% maximum SUV), and the blue outline circumscribes the post-treatment MTV2.0 (metabolic tumor volume with an absolute SUV threshold of 2.0).
