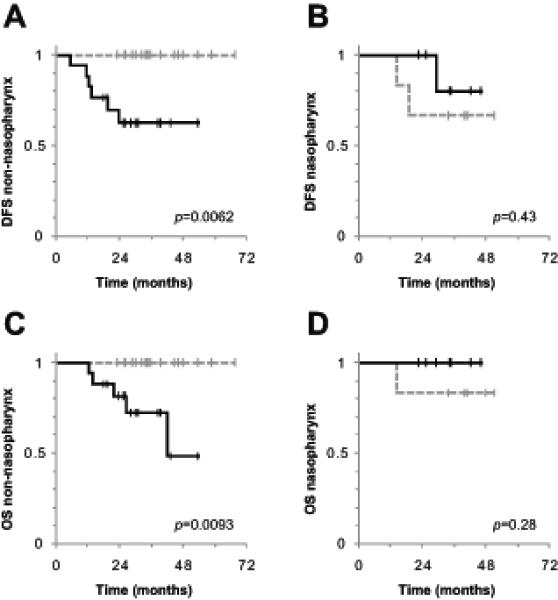
Figure 4.

Post-treatment MTV2.0 predicts outcome in non-nasopharyngeal histology.
Plots represent Kaplan-Meier curves of DFS (A and B), and OS (C and D), in patients with non-nasopharyngeal (A and C), and nasopharyngeal histology (B and D). The Bonferroni corrected level of significance was p=0.025. The dotted gray lines represent post-treatment MTV2.0 <median, and the solid black lines represent post-treatment MTV2.0 ≥median. Abbreviations: DFS = disease free survival, OS = overall survival, MTV2.0 = metabolic tumor volume with an SUV threshold of 2.0 (described in methods).
