
Figure 2.
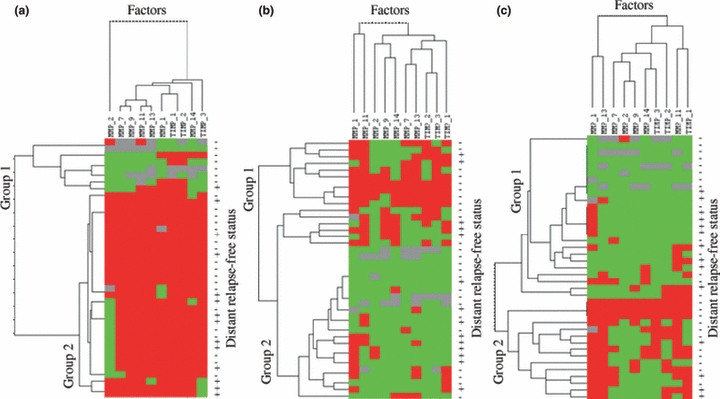
Hierarchical clustering analysis of global MMPs/TIMPs expression in the different cells types of breast cancer as measured by immunohistochemistry on TA. Graphical representation of hierarchical clustering results in tumoral cells (a), fibroblasts (b) and mononuclear inflammatory cells (c). Rows, tumour samples; columns, MMPs/TIMPs. Protein expressions are depicted according to a colour scale: red, positive staining; green, negative staining; grey, missing data. The status columns: + = with recurrence; − = without recurrence, at the census point. Two major cluster of tumours are shown for fibroblast-like cells and mononuclear inflammatory cells.