

Abstract
A significant proportion of patients with osteogenic sarcoma die from lung metastasis within 5 years of diagnosis. Molecular signatures that predict pulmonary metastasis from primary osteogenic sarcoma and identify those patients at risk would be clinically useful as prognostic markers. Protein expression profiles of two clonally related murine osteogenic sarcoma cell lines with low (K12) and high (K7M2) metastatic potential were compared using two different proteomic technologies, two-dimensional difference gel electrophoresis and cell profiling by matrix-assisted laser desorption/ionization mass spectrometry. Interrogation of a molecular pathways network database suggested several additional candidate molecules that potentially predict metastatic potential of primary osteogenic sarcoma. Two such proteins, macrophage migration inhibitory factor and tumour necrosis factor were selected for further validation studies. Western blots confirmed increased expression of both cytokines in K7M2 cells compared to K12 cells. Levels of migration inhibitory factor and tumour necrosis factor were semi-quantitatively measured in human osteogenic sarcoma samples by immunohistochemistry and were correlated with clinicopathologic parameters and patient outcomes. Multivariate survival analysis demonstrated that tumour necrosis factor expression in chemotherapy naïve osteogenic sarcoma is an independent prognostic factor for overall and metastasis-free survival. No significant differences in adverse outcomes were observed based on macrophage migration inhibitory factor expression.
Keywords: macrophage migration inhibitory factor, metastasis, osteosarcoma, prognosis, proteomics, tumour necrosis factor
Approximately 20–30% of patients with osteogenic sarcoma (OGS) die from pulmonary metastasis within 5 years of their initial diagnosis (Gorlick et al. 2003; Hayden & Hoang 2006; Marina et al. 2004). Molecular signatures that predict increased risk of pulmonary metastasis from primary OGS would be useful prognostic markers, but no such profile has been demonstrated to be clinically applicable (Clark et al. 2008; Hayden & Hoang 2006; Marina et al. 2004). Moreover, these signatures may implicate signalling pathways differentially activated in tumours with increased metastatic potential and the proteins involved in these pathways might represent novel therapeutic targets (Wang 2005).
The murine OGS cell lines (K12 and K7M2) characterized by Khanna et al. (2000) demonstrate markedly different metastatic potentials and are a valuable animal model for studying the mechanisms of OGS metastasis. Parental K12 and K7 cell lines were initially established from a spontaneous murine OGS (Schmidt et al. 1988). Selection for cells with increased metastatic potential was performed by repeated orthotopic implantation of tissue from the pulmonary metastases generated after intra-osseous injection of parental K7 cells. This strategy was used to generate the clonal derivative K7M2 cell line (Khanna et al. 2000). Whereas the K12 cell line generates pulmonary metastases in approximately 30% of mice after orthotopic injection of tumour cells, over 90% of mice injected with K7M2 cells develop metastatic disease (Khanna et al. 2000). The proteins differentially expressed in K7M2 cells and responsible for this aggressive phenotype may reflect deregulated intracellular signalling cascades relevant to the metastatic process. In addition, these candidate biomarkers may be useful as prognostic markers predictive of lung metastasis and as novel therapeutic targets in OGS.
In this study, protein expression profiles of the K12 and K7M2 OGS cell lines were compared by matrix-assisted laser desorption/ionization mass spectrometry (MALDI-MS) and two-dimensional difference gel electrophoresis (2D-DIGE). Tissue profiling with MALDI–MS generates mass spectra containing signals from many hundreds to thousands of proteins and peptides that represent the protein expression pattern of the target tissue and is an effective technique for discovery of tumour-specific proteins (Caldwell & Caprioli 2005). The 2D-DIGE methodology allows direct comparison and relative quantification of specific proteins among different samples resolved together on the same gel using different cyanine fluorescent dyes (Friedman et al. 2004, 2007). Standard liquid chromatography tandem mass spectroscopy and database searches are used for protein identification.
Tissue profiling and 2D-DIGE of K12 and K2M7 cells revealed distinct differences in the protein expression patterns between these clones. Subsequent molecular pathway network analysis suggested several candidate molecules predictive of OGS metastasis to lung. Further efforts were focused on two proteins, macrophage migration inhibitory factor (MIF) and tumour necrosis factor (TNF) because (1) these proteins have been associated previously with human malignancies (Balkwill 2009; Denz et al. 2009; Meyer-Siegler et al. 2006; Mitchell 2004; Mocellin & Nitti 2008; Sethi et al. 2008; Sun et al. 2005; Szlosarek et al. 2006), (2) as circulating cytokines, these molecules are detectable in peripheral blood and therefore may be measured as serum biomarkers of metastatic potential, and (3) therapeutic agents can specifically target and inhibit the actions of these molecules (Cvetkovic & Stosic-Grujicic 2006; Dabideen et al. 2007; Garai & Lorand 2009; Mocellin & Nitti 2008; Morand 2005; Ogawa et al. 2000; Ren et al. 2006; Sethi et al. 2008).
Methods
Cell lines and human OGS tissue microarray
Clonally-related murine OGS cell lines with low (K12) and high (K7M2) metastatic potential were generously provided by the laboratory of Dr Lee Helman (National Institute of Diabetes and Digestive and Kidney Diseases, Pediatric Oncology Branch, National Cancer Institute, National Institutes of Health, Bethesda, MD, USA) and were maintained in DMEM (Mediatech, Inc., Manassas, VA, USA) containing 2 mM l-glutamine, 10% fetal bovine serum, and 100 μg/ml penicillin-streptomycin at 37 °C and 5% CO2. For preparation of cell lysates, K12 and K7M2 cells were grown to a confluent monolayer in a T-75 flask and subjected to overnight serum starvation. The culture media was aspirated and the cells were washed with 5 ml phosphate-buffered saline (PBS) at 4 °C before harvesting. Cells were scraped off the surface of the flask in 500 μl of RIPA buffer (Pierce Biotechnologies, Rockford, IL, USA) containing protease inhibitor cocktail (Sigma-Aldrich, St Louis, MO, USA) and transferred to 1.5 ml Eppendorf tubes. Cells were homogenized by passage through a 21-gauge needle five times and the lysates were subsequently stored at −80 °C.
The study protocol was approved by the Vanderbilt University Institutional Review Board; the requirement for informed consent was waived by this committee. A computerized search of the Surgical Pathology files at Vanderbilt University Medical Center was performed for all cases of high grade osteogenic sarcoma accessioned from 1991 to 2004. All cases retrieved from the Surgical Pathology archives with adequate surplus diagnostic tissue were included in this study. A human OGS tissue microarray (TMA) composed of duplicate tissue cores (1.0 mm in diameter) was constructed from representative areas of histologically viable tumour extracted from formalin-fixed, demineralized, paraffin-embedded tissue blocks using a manual arrayer (Beecher Instruments, Sun Prairie, WI, USA). The TMA contained 156 specimens of high-grade OGS from 101 patients, 67 of which were biopsied or resected prior to administration of adjuvant cytotoxic therapy. Another set of 67 OGS samples represented on the TMA were from specimens resected after exposure to neoadjuvant therapy. In addition, 14 metastatic OGS and 8 samples from local recurrences were included in the TMA. The study group assembled on the TMA consisted of 65 osteoblastic, 14 fibroblastic, and 11 chondroblastic types of conventional intramedullary OGS; 11 cases were classified as ‘other types’ for statistical analysis (four high-grade surface OGS, four small cell type, two telangiectatic and one periosteal OGS). Low-grade OGS were excluded from this study.
Both the pre-treatment biopsy and the corresponding surgical resection specimen status post-neoadjuvant therapy were available for comparison analysis in 34 cases. In an additional 16 cases, paired tissue samples of locally recurrent (n = 6) or metastatic tumour (n = 10) were available for comparison to the primary resection specimen. Patient charts were reviewed to record clinical data (patient age and gender, exposure to neoadjuvant therapy, TNM stage at diagnosis, and patient outcome). The interval from the date of the initial biopsy or resection to any adverse event (defined as death due to disease or radiographic or pathologic confirmation of local recurrence or distant metastasis) was also recorded.
The median patient age was 21 years (range: 5–82 years). Most cases involved the appendicular skeleton (femur = 43, tibia = 23, humerus = 13, fibula = 1); the remaining 20 cases were combined into an axial/pelvic group for statistical analysis (craniofacial = 9, pelvic = 8, vertebral = 3). The extent of coagulative tumour necrosis after neoadjuvant therapy was assessed according to established and standard protocols; 38% of patients showed >90% necrosis. Eleven patients (10%) presented with metastatic disease or were found to have metastatic disease within 2 weeks of surgical resection and were considered Stage IV at presentation. Aside from one patient who presented with a discontinuous lesion of the humerus, all other patients presented with Stage II disease.
MALDI-MS analysis
Cells (1.05 × 10⁵) were washed twice in PBS and resuspended in 5.0 μl of PBS. A 1.0 μl aliquot of cell suspension was transferred to a MALDI target plate and dried in a vacuum desiccator at room temperature for at least 30 min. Matrix (1.0 μl of 30 mg/ml sinapinic acid in 50% (v/v) acetonitrile/0.3% trifluoroacetic acid) was deposited onto each cell aliquot and dried as described above. Mass spectra were acquired from the cell pellet in linear positive mode on a Voyager DE-STR time-of-flight mass spectrometer (Applied Biosystems Inc., Foster City, CA, USA) using an acceleration voltage of 25 kV, grid voltage of 22.75 kV, guide wire voltage of 25 V with a delay time of 550 ns. A 337 nm N2 laser operating at a 20 Hz repetition rate was used to sum 1000 shots per cell aliquot spot into a single spectrum. Spectra were acquired in quadruplicate for each of the cell lines. Each mass spectrum was externally calibrated with a protein mixture of porcine insulin (m/z 5777.60), bovine cytochrome c (m/z 12232.0), equine apomyoglobin (m/z 16952.0), and bovine trypsinogen (m/z 23976.0) and internally calibrated using peaks from murine histones H2B2 (m/z 13805) and H4 (m/z 11306). Mass spectra were baseline corrected, Gaussian smoothed and calibrated using Data Explorer software (Applied Biosystems Inc.).
Two-dimensional difference gel electrophoresis
The mixed internal standard methodology of Friedman et al. (2004, 2007) was used as previously described. Briefly, protein samples were differentially labelled using three cyanine fluorescent dyes (Amersham Biosciences, Piscataway, NJ, USA). Groups of labelled cell lysates (500 μg protein) were then co-resolved on 24-cm isoelectric focusing gradients (pH 4–7) together with an aliquot of pooled sample internal standard. Gels were run in quadruplicate and fluorophores were imaged separately using mutually exclusive excitation/emission spectra, allowing for direct quantitative measurement for each protein within a sample. DeCyder 2D-DIGE Analysis Software v6.5 (Amersham Biosciences) was used to compare the abundance of each protein from each sample relative to its internal standard signal within an individual gel and to normalize abundance values for each protein between different gel runs.
Protein identification
Proteins of interest were identified by standard peptide mapping/fingerprinting and database interrogation. DIGE gels were post-stained with Spyro Ruby (Molecular Probes, Carlsbad, CA, USA) and an automated Ettan Spot Handling Workstation (Amersham Biosciences) was used to excise and process protein spots for in-gel trypsin protease digestion. Peptides were extracted from the gel plugs, mixed with α-cyano-4-hydroxycinnamic acid (5 mg/ml in 60% acetonitrile supplemented with 1 mg/ml ammonium citrate) and spotted onto a stainless steel target for protein identification analysis. Peptide ion mapping/fingerprinting was performed on a Voyager 4700 mass spectrometer (Applied Biosystems); MALDI-MS was internally calibrated using trypsin autolytic fragments in digests to provide mass accuracy within 20 ppm. Subsequent liquid chromatography-tandem time-of-flight mass spectrometry was used to fragment selected individual peptide ions and analyse the fragmentation patterns to generate amino acid sequence information. Both types of mass spectral data were collectively used to interrogate protein databases and generate statistically significant candidate identifications using GPS Explorer software (Applied Biosystems) running the MASCOT database search algorithm (Matrix Science, Boston, MA, USA). First-pass searches were performed against the Swiss-Prot and the NCBInr databases without constraining protein molecular weight, isoelectric point, or molecular species. Carbamidomethylation of cysteines was performed and partial oxidation of methionine residues was allowed in search parameters. Species constraints were invoked for second-pass searches as needed.
Western blots
Cell lysates (25 μg of protein) were electrophoresed on a 10% Tris–HCl polyacrylamide gel (Bio-Rad Laboratories, Hercules, CA, USA) and transferred to polyvinylidene fluoride membranes (Millipore, Billerica, MA, USA). Membranes were blocked with 10% milk/1% Tween 20 solution in PBS for 1 h at RT, washed three times with 1% Tween 20 in PBS for 10 min at RT, and subsequently incubated overnight at 4 °C in a 5% milk solution containing 1:200 of monoclonal anti-TNF (ab1793; Abcam, Cambridge, MA, USA) or polyclonal anti-MIF (sc-20121; Santa Cruz Biotech, Santa Cruz, CA, USA). Membranes were washed as above and incubated with a 1:10,000 dilution of horseradish peroxidase-conjugated anti-mouse or anti-rabbit secondary IgG (Cell Signaling Technology, Danvers, MA, USA) in 5% milk solution for 1 h at RT. After three washes, the blots were developed using the ECL-Plus Western Blot Reagent Pack (GE Healthcare, Piscataway, NJ, USA) according to manufacturers’ recommendations. Membranes were stripped by shaking in 10 ml Restore Western Blot Stripping Buffer (Pierce Biotechnologies) for 30 min at RT and reprobed with monoclonal anti-β-actin (1:1000, Sigma Aldrich).
Immunohistochemistry
All tissue samples were fixed in neutral-buffered formalin before demineralization in RDO Rapid Decalcifier (Apex Engineering Products Corporation, Aurora, IL, USA). To ensure preservation of MIF and TNF immunoreactivity throughout the demineralization process, immunohistochemical (IHC) stains were optimized using positive control tissues that were incubated overnight in RDO after formalin-fixation. Tissue sections were incubated in pre-heated Target Retrieval Solution, Citrate pH 6 (Dako, Carpinteria, CA, USA) in a Decloaking Chamber (Biocare Medical, Concord, CA, USA) at 120 °C for 20 min. Endogenous peroxidase was neutralized with 0.03% H2O2 followed by a casein-based protein block (Dako) to minimize nonspecific staining. TMA sections were incubated with anti-MIF diluted 1:200 for 60 min at room temperature or anti-TNF diluted 1:50 overnight at 4 °C. Primary antibody was detected using the Dako EnVision+ HRP/DAB System (Dako). TMA slides in which incubation with primary antibody was omitted served as negative controls. IHC slides were reviewed in a blinded manner and staining of tumour cell cytoplasm was scored according to the Allred criteria (Allred et al. 1993). For cases in which the IHC scores for the duplicate tissue cores were discrepant, the scores were averaged and rounded up to an integer value. Allred indices were subsequently categorized as ‘negative’ (0), ‘weak’ (2–5), or ‘strong’ (6–8) for statistical analysis. Pilot studies using whole sections of human osteosarcoma samples demonstrated insignificant regional heterogeneity in the distribution or intensity of MIF or TNF staining (data not shown). In addition, Allred scores for MIF and TNF demonstrated relatively good concordance between duplicate TMA cores, with 89% and 94% of scores within 2 units of each other, respectively.
Bioinformatics and statistical analysis
MALDI mass spectra were converted to text files and imported into ProTSData v1.1 (Biodesix, Inc., Steamboat Springs, CO, USA) for baseline correction and intensity normalization by total ion current in batch mode. For comparisons of MALDI mass spectra, a standard weighted-means-averaging algorithm was applied, thus filtering m/z intensities according to the highest weight that best differentiated K7M2 cells from K12 cells. Further filtering was carried out to exclude weighted-means-averages <1.0 (similar in respect to 2σ from the mean control value) and mean intensity differences that were less than twofold (an experimentally determined cut-off value often applied for tissue profiling, data not published). Filtered values were then used for peak detection and further evaluated by plotting the entire spectrum compared to the difference spectrum in Origin 7.0 (OriginLab Corporation, Northampton, MA, USA). Mean differences in relative ion intensity of m/z peaks were evaluated using Student’s t-test and proteins with a P-value of <0.01 were selected as proteins of interest for further study.
Subsequent network generation and functional analysis were performed using Ingenuity Pathways Analysis v6.3 software (Ingenuity® Systems, Redwood City, CA, USA). Proteins differentially expressed in K7M2 cells which demonstrated a minimum fold change of ±1.2 in statistical analysis of 2D-DIGE data or at least a two-fold change in ion intensity by MALDI-MS were included in the analysis. A dataset containing the NCBI RefSeq protein accession numbers and the corresponding fold-change in expression levels of the differentially expressed proteins was overlaid onto a global molecular network developed from the Ingenuity Pathways Knowledge Base, a manually curated repository of molecular interactions, regulatory events, and genotype–phenotype associations compiled from primary scientific literature sources (http://www.ingenuity.com). Networks of these proteins were then algorithmically generated based on their connectivity.
Associations between expression of the biomarkers and clinicopathologic and prognostic variables were investigated using standard univariate methods. Differences in Kaplan–Meier overall and metastasis-free survival curves were evaluated using the log rank (Mantel–Haenszel) test statistic. For log-rank tests, patients were dichotomized by age into pediatric (≤21 years) and adult cases (>21 years). For anatomic site, cases were considered as either arising in the appendicular or axial/pelvic skeleton. Tumour necrosis was dichotomized into ‘good response’ (≥90%) and ‘poor response’ (<90%). Ki-67 indices (percent of Ki-67-positive tumour cells) were arbitrarily categorized into the following groups: 0 (25% of cases), 1–5 (29% of cases), 6–15 (29% of cases), and >15 (17% of cases) for log rank analysis. Subsequent multivariable survival analysis was performed according to the Cox proportional-hazards regression model, adjusting for clinicopathologic parameters associated with P-values <0.10 in univariate analysis. All statistical analyses were performed using the Hmisc and survival packages installed on R software (v.2.9.0) (Harrell 2009; R Development Core Team 2009; Therneau & Lumley 2009).
Results
Proteomic analysis of K7M2 and K12 cells
Protein profiling of murine OGS cells by MALDI-MS detected 9 protein peaks that show at least two-fold differences in relative ion intensities in K7M2 cells compared to K12 cells (Figure 1). Of the six protein peaks increased in K7M2 cells, four have been previously identified as MIF (Decker et al. 2003), thymosin β10 (Xu et al. 2005), protein S100-A6 (calcyclin) (Meier et al. 2005), and ubiquitin B (Reyzer et al. 2004). None of the three peaks which show at least 50% reduction in ion intensity in K7M2 cells have been identified. Similarly, 2D-DIGE experiments (Figure 2) identified several proteins differentially expressed in K7M2 and K12 cells (Table 1). The dataset of 20 proteins identified by tissue profiling and 2D-DIGE was uploaded into Ingenuity Pathway Analysis software. Output of network analysis implicated 95 additional proteins in promoting the metastatic phenotype, including the cytokine TNF and other growth factors (Table 2).
Figure 1.
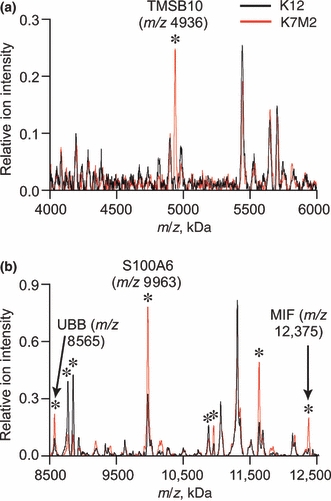
Averaged mass spectra from matrix-assisted laser desorption/ionization time-of-flight mass spectrometry cell profiling experiments [(a), m/z 4–6 kDa; (b), m/z 8.5–13 kDa]. Protein peaks with ion intensities significantly different in K7M2 cells (red line) compared to parental K12 cells (black line) are labelled with an asterisk, including four previously identified as thymosin β10 (TMSB10), ubiquitin B (UBB), S100A6, and macrophage migration inhibitory factor (MIF).
Figure 2.
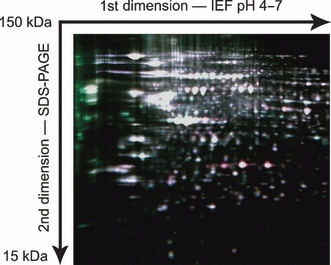
Representative two-dimensional difference gel electrophoresis gel using mixed internal standard methodology. Cell lysates and the pooled internal standard were differentially labelled using three cyanine fluorescent dyes and co-resolved on 24-cm isoelectric focusing gradients (pH 4–7). Following second dimension SDS–PAGE, gels were imaged using mutually exclusive excitation/emission spectra and the intensity of each fluorescent signal was digitally quantified. This composite image demonstrates increased amounts of proteins in metastatic K7M2 cells (red spots) and parental K12 cells (green spots), compared to the internal standard consisting of a mixed pool of K7M2 and K12 lysate (white spots).
Table 1.
Summary of proteins differentially expressed in K7M2 and K12 cells identified by two-dimensional difference gel electro-phoresis
| Murine protein | UniProtKB accession | MW (kDa); pI* | Avg. vol. ratio (P)† |
|---|---|---|---|
| Vimentin | P20152 | 53.6; 5.1 | 1.68 (0.002) |
| Endoplasmin | P08113 | 92.7; 4.7 | 1.61 (<0.001) |
| Chloride intracellular channel 4‡ | Q9QYB1 | 28.8; 5.4 | 1.39 (0.009) |
| Transaldolase | Q93092 | 37.5; 6.6 | 1.35 (0.004) |
| Annexin A1 | P10107 | 38.8; 7.1 | 1.35 (0.004) |
| Ubiquitin carboxyl-terminal hydrolase 5 | P56399 | 96.7; 4.9 | 1.34 (0.001) |
| Prohibitin | P67778 | 29.8; 5.6 | 1.33 (0.007) |
| Proteasome activator complex subunit 2 | P97372 | 27.0; 5.5 | 1.33 (0.007) |
| Eukaryotic initiation factor 4A-I | P60843 | 46.4; 5.3 | 1.32 (0.007) |
| Voltage-dependent anion-selective channel protein 1 | Q60932 | 32.5; 8.6 | 1.32 (0.006) |
| Gelsolin | P13020 | 86.3; 5.8 | 1.27 (0.002) |
| Advillin | O88398 | 92.4; 5.4 | 0.57 (<0.001) |
| Elongation factor Tu‡ | Q8BFR5 | 45.0; 6.2 | 0.76 (0.008) |
| Farnesyl pyrophosphate synthetase | Q920E5 | 40.9; 5.5 | 0.78 (0.004) |
| Acyl-coenzyme A thioesterase 2‡ | Q9QYR9 | 45.0; 6.1 | 0.79 (0.005) |
| V-type proton ATPase subunit B, brain isoform | P62814 | 56.8; 5.6 | 0.81 (0.001) |
Theoretical molecular weights (MW) and isoelectric points (pI) calculated from UniProtKB database (UniProt Consortium 2009) entries often contain precursor sequences not present in the mature form migrating on the gel.
Average volume ratio (Avg. Vol. Ratio) of spot intensity in K7M2 cells compared to K12 cells. P-values from Student’s t-test were calculated with DeCyder software (v6.5) utilizing the mixed-sample internal standard methodology of Friedman et al. (2004, 2007).
Mitochondrial isoforms.
Table 2.
Summary of potential biomarkers for metastatic phenotype implicated by Ingenuity Pathways Analysis*
| Human protein† | NCBI RefSeq | Protein type | Putative function |
|---|---|---|---|
| 5-hydroxytryptamine receptor 2C | NP_000859.1 | GPCR | Pleiotropic |
| Actin-like protein 6A | NP_004292.1 | Actin-related protein | Transcriptional regulation |
| Activating transcription factor 5 | NP_036200.2 | Transcription factor | Transcriptional regulation |
| Annexin A11 | NP_001148.1 | Ca2+/PL-binding protein | Immune response |
| Asialoglycoprotein receptor 2 | NP_001172.1 | Lectin | Protein trafficking |
| Calbindin 1 | NP_004920.1 | Ca2+-binding protein | Unknown |
| Calponin 3, acidic | NP_001830.1 | Actin-binding protein | Cytoskeletal organization |
| CD5 | NP_055022.2 | TM receptor | T-cell stimulation |
| CD86 | NP_787058.3 | TM receptor | T-cell stimulation |
| Cell division cycle 34 homolog | NP_004350.1 | Enzyme | Cell cycle regulation |
| Chaperonin containing TCP1, subunit 4 (delta) | NP_006421.2 | Molecular chaperone | Protein folding |
| Chemokine (C-X-C motif) ligand 2 | NP_002080.1 | Chemokine | Immune response |
| Coactosin-like 1 | NP_066972.1 | Actin-binding protein | Cytoskeletal organization |
| Coagulation factor II receptor-like 1 | NP_005233.3 | GPCR | Chemotaxis |
| COPS5 | NP_006828.2 | Other | Cell cycle regulation |
| Corticotropin releasing hormone | NP_000747.1 | Neuropeptide hormone | Pleiotropic |
| Cortistatin | NP_001293.2 | Neuropeptide hormone | Unknown |
| Cyclin-dependent kinase inhibitor 1B | NP_004055.1 | Other | Cell proliferation |
| CYP7A1 | NP_000771.2 | Electron carrier | Oxidative metabolism |
| Deoxyribonuclease-1 | NP_005214.2 | Enzyme | Apoptosis |
| DNA-damage-inducible transcript 3 | NP_004074.2 | Transcription factor | Apoptosis |
| Drebrin 1 | NP_004386.2 | Actin-binding protein | Cytoskeletal organization |
| E2F transcription factor 5, p130-binding | NP_001942.2 | Transcription factor | Transcriptional regulation |
| Emerin | NP_000108.1 | Other | Nuclear lamina protein |
| Epidermal growth factor | NP_001954.2 | Growth factor | Cell growth |
| Erythropoietin | NP_000790.2 | Cytokine | Cell survival |
| Estrogen-related receptor alpha | NP_004442.3 | LDNR | Transcriptional regulation |
| Eukaryotic translation initiation factor 2α kinase 3 | NP_004827.4 | Kinase | Translational regulation |
| Eukaryotic translation initiation factor 4γ, 1 | NP_886553.2 | Other | Translational regulation |
| Eukaryotic translation initiation factor 4 γ, 2 | NP_001409.1 | Other | Translational regulation |
| Exportin 6 | NP_055986.1 | Actin-binding protein | Protein trafficking |
| Fatty acid synthase | NP_004095.4 | Enzyme | Fatty acid synthesis |
| Fc fragment of IgG, receptor, transporter, alpha | NP_001129491.1 | IgG receptor | Immune response |
| FK506-binding protein 4 | NP_002005.1 | Enzyme | Protein trafficking |
| Forkhead box O1 | NP_002006.2 | Transcription factor | Transcriptional regulation |
| GFI1 | NP_001120687.1 | Transcription factor | Transcriptional regulation |
| Granzyme B | NP_004122.2 | Peptidase | Cytolysis |
| Growth hormone 1 | NP_000506.2 | Hormone | Cell growth |
| Hepatocyte growth factor | NP_000592.3 | Growth factor | Pleiotropic |
| Hepatocyte nuclear factor 4, alpha | NP_000448.3 | Transcription factor | Transcriptional regulation |
| HRAS | NP_005334.1 | GTP-binding protein | Pleiotropic |
| Insulin induced gene 1 | NP_005533.2 | Other | Cholesterol metabolism |
| Integrin, alpha 4 | NP_000876.3 | Integrin alpha chain | Cell adhesion |
| Integrin, alpha L | NP_002200.2 | Integrin alpha chain | Cell adhesion |
| Interferon, gamma-inducible protein 16 | NP_005522.2 | Transcription factor | Transcriptional regulation |
| Interleukin 1, beta | NP_000567.1 | Cytokine | Pleiotropic |
| Interleukin 6 | NP_000591.1 | Cytokine | Pleiotropic |
| Interleukin 12B | NP_002178.2 | Cytokine | Pleiotropic |
| KIT ligand | NP_000890.1 | Growth factor | Pleiotropic |
| LIM domain kinase 1 | NP_002305.1 | Kinase | Signal transduction |
| Macrophage scavenger receptor 1 | NP_619729.1 | TM receptor | Cholesterol transport |
| Matrix metallopeptidase 13 | NP_002418.1 | Peptidase | Collagen proteolysis |
| Microsomal triglyceride transfer protein | NP_000244.2 | Transporter | Lipid metabolism |
| Moesin | NP_002435.1 | ERM protein | Cytoskeleton |
| MYCN | NP_005369.2 | Transcription factor | Transcriptional regulation |
| Myosin, heavy chain 9, non-muscle | NP_002464.1 | Actin-binding protein | Cell motility |
| Neutrophil cytosolic factor 1C pseudogene | NR_003187.1 | Unknown | Unknown |
| Non-metastatic cells 3, protein expressed in | NP_002504.2 | Kinase | Nucleotide synthesis |
| Nuclear receptor subfamily 0, group B, member 2 | NP_068804.1 | Orphan nuclear receptor | Transcriptional regulation |
| Peroxisome proliferator-activated receptor-γ | NP_005028.4 | LDNR | Transcriptional regulation |
| Phosphatase and actin regulator 1 | NP_112210.1 | Actin-binding protein | Unknown |
| Plasminogen | NP_000292.1 | Peptidase | Fibrinolysis |
| Plastin-1 | NP_001138791.1 | Actin-binding protein | Cytoskeleton |
| Plectin-1 | NP_958782.1 | Plakin | Cytoskeleton |
| PPARGC1A | NP_037393.1 | Transcription factor | Transcriptional regulation |
| PPARGC1B | NP_573570.2 | Transcription factor | Transcriptional regulation |
| Profilin 1 | NP_005013.1 | Actin-binding protein | Cytoskeletal organization |
| Programmed cell death 4 | NP_055271.2 | Other | Apoptosis |
| Prolactin | NP_000939.1 | Hormone | Cell proliferation |
| Proteasome subunit, beta type, 7 | NP_002790.1 | Peptidase | Protein degradation |
| Proteasome subunit, beta type, 8 | NP_004150.1 | Peptidase | Protein degradation |
| Proteasome subunit, beta type, 9 | NP_002791.1 | Peptidase | Protein degradation |
| Pyruvate dehydrogenase kinase, isozyme 1 | NP_002601.1 | Enzyme | Glucose metabolism |
| RAB8B, member RAS oncogene family | NP_057614.1 | GTP-binding protein | Signal transduction |
| Scavenger receptor class F, member 1 | NP_003684.2 | TM receptor | Cholesterol catabolism |
| Scinderin | NP_001106177.1 | Actin-binding protein | Cytoskeletal organization |
| Secreted protein, acidic, cysteine-rich | NP_003109.1 | ECM-binding protein | Signal transduction |
| Serine/threonine kinase 11 | NP_000446.1 | Kinase | Cell proliferation |
| Serpin peptidase inhibitor, clade C, member 1 | NP_000479.1 | Protease inhibitor | Coagulation |
| SREBF2 | NP_004590.2 | Transcription factor | Cholesterol metabolism |
| Thyrotropin-releasing hormone | NP_009048.1 | Neuropeptide hormone | Signal transduction |
| TIAL1 | NP_003243.1 | RNA-binding protein | Transcriptional regulation |
| Toll-like receptor 2 | NP_003255.2 | TM receptor | Inflammatory response |
| Toll-like receptor 4 | NP_612564.1 | TM receptor | Inflammatory response |
| Transporter 2, ATP-binding cassette, subfamily B | NP_000535.3 | Transporter | Protein trafficking |
| Tribbles homolog 3 (Drosophila) | NP_066981.2 | Kinase | Transcriptional regulation |
| Tripartite motif-containing 22 | NP_006065.2 | Transcription factor | Transcriptional regulation |
| TRRAP | NP_003487.1 | Transcription factor | Transcriptional regulation |
| Tumour necrosis factor | NP_000585.2 | Cytokine | Pleiotropic |
| Tumour protein p53 | NP_000537.3 | Transcription factor | Transcriptional regulation |
| Ubiquitin carboxyl-terminal esterase L3 | NP_005993.1 | Peptidase | Protein degradation |
| Unc-51-like kinase 1 | NP_003556.1 | Kinase | Signal transduction |
| Uridine phosphorylase 1 | NP_003355.1 | Enzyme | Nucleotide catabolism |
| Vitronectin | NP_000629.3 | ECM-binding protein | Cell adhesion |
| von Willebrand factor | NP_000543.2 | Other | Cell-substrate adhesion |
2D-DIGE,two-dimensional difference gel electrophoresis; COPS5, COP9 constitutive photomorphogenic homolog subunit 5; CYP7A1, cytochrome P450, family 7, subfamily A, polypeptide 1; ECM, extracellular matrix; ERM, ezrin, radixin and moesin protein family; GFI1, growth factor independent 1 transcription repressor; GPCR, G-protein coupled receptor; HRAS, v-Ha-ras Harvey rat sarcoma viral oncogene homolog; LDNR,ligand-dependent nuclear receptor; MALDI-MS matrix-assisted laser desorption/ionization-mass spectrometry; MYCN, v-myc, myelocytomatosis viral related oncogene, neuroblastoma derived; PL, phospholipid; PPARGC1A, peroxisome proliferator-activated receptor-γ, coactivator 1α; PPARGC1B, peroxisome proliferator-activated receptor-γ, coactivator 1β; SREBF2, sterol regulatory element binding transcription factor 2; TIAL1, TIA1 cytotoxic granule-associated RNA-binding protein-like 1; TM, transmembrane; TRRAP, transformation/transcription domain-associated protein.
Ingenuity Pathway Analysis v6.3 (Ingenuity® Systems, http://www.ingenuity.com).
Protein nomenclature, classification, and putative functions are from the National Center for Biotechnology Information (NCBI) Entrez Gene online database (http://www.ncbi.nlm.nih.gov/sites/entrez).
MIF and TNF expression in human OGS
Western blot analysis confirmed that levels of both MIF and TNF are increased in K7M2 cell lysates compared to K12 cells (Figure 3). Therefore, a human OGS TMA was stained for MIF and TNF expression by IHC to assess the prognostic potential of these two cytokines (Figure 4). There were no statistically significant differences in the distribution of IHC scores for MIF among the different specimen types (Table 3). Post-hoc analysis (Dunn’s multiple comparison test) of the distribution of IHC scores for TNF demonstrated increased TNF levels in tumours resected following neoadjuvant therapy compared to pre-treatment biopsy specimens, but not metastatic or locally recurrent tumours.
Figure 3.
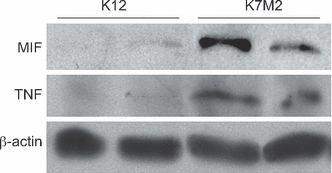
Western blots of K7M2 and K12 cell lysates. Cell lysates from two separate passages of K7M2 and K12 cell lines were subjected to SDS-PAGE for detection of macrophage migration inhibitory factor and tumour necrosis factor by immunoblotting. Band densities of replicate samples were quantified and normalized against total cellular β-actin content. Mean relative levels of macrophage migration inhibitory factor and tumour necrosis factor are increased in K7M2 cells compared to K12 cells.
Figure 4.
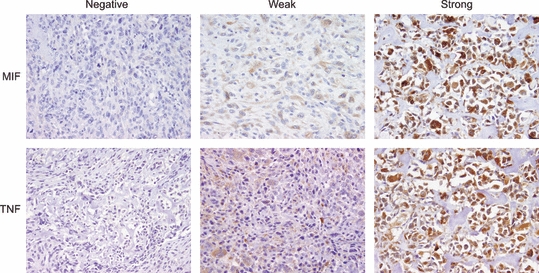
Intracytoplasmic staining for macrophage migration inhibitory factor (MIF) and tumour necrosis factor (TNF) in high-grade human osteosarcoma (immunohistochemical stains of representative cases, 200X ).
Table 3.
Macrophage migration inhibitory factor and tumour necrosis factor staining in high-grade osteosarcoma by specimen type
| A. | |||
|---|---|---|---|
| MIF-negative | Weak MIF | Strong MIF | |
| Overall | 56 (36%) | 33 (21%) | 65 (42%) |
| Pre-adjuvant therapy | 30 (46%) | 13 (20%) | 22 (34%) |
| Post-adjuvant therapy | 22 (33%) | 12 (18%) | 33 (49%) |
| Local recurrence | 2 (25%) | 2 (25%) | 4 (50%) |
| Metastasis | 2 (14%) | 6 (43%) | 6 (43%) |
| B. | |||
|---|---|---|---|
| TNF-negative | Weak TNF | Strong TNF | |
| Overall | 68 (45%) | 30 (20%) | 54 (36%) |
| Pre-adjuvant therapy | 36 (55%) | 12 (18%) | 18 (27%) |
| Post-adjuvant therapy | 21 (33%) | 13 (20%) | 30 (47%) |
| Local recurrence | 3 (38%) | 2 (25%) | 3 (38%) |
| Metastasis | 8 (57%) | 3 (21%) | 3 (21%) |
Kruskal–Wallis rank sum test, P-value = 0.18.
Kruskal–Wallis rank sum test, P-value = 0.039.
Tumour samples from paired pre-treatment biopsies and the corresponding resection specimens following administration of adjuvant therapy were available for comparison in 34 cases. No significant differences in the IHC scores for MIF or TNF following administration of adjuvant chemotherapy were detected among the matched chemotherapy naïve biopsy specimens and the corresponding resection specimens (Wilcoxon matched-pairs signed ranks test, P= 0.47 and P= 0.12, respectively). Similarly, there were no differences in TNF scores between 16 primary tumours and paired samples of locally recurrent or metastatic disease (P= 0.42). However, MIF scores were significantly higher in local recurrences and distant metastases compared to paired primary resection specimens (P= 0.015). Therefore, study cases were categorized into three groups for subsequent statistical analyses: (1) tumours sampled prior to administration of adjuvant therapy (chemotherapy naïve), (2) primary specimens resected after exposure to adjuvant therapy, and (3) locally recurrent or metastatic tumours.
For the group of OGS cases sampled prior to exposure to adjuvant therapy, there were no statistically significant differences in the distribution of IHC scores for MIF or TNF among the different TNM stages (Stage II vs. Stage IV), anatomic sites involved (appendicular vs. axial/pelvic), histologic subtypes of OGS represented, or extent of coagulative tumour necrosis (Table 4 and data not shown). Similarly, there was no correlation between MIF or TNF and patient age or Ki-67 index. In samples of OGS resected after neoadjuvant therapy however, the Ki-67 index correlated with increased MIF staining (Table 5A). Strong MIF staining was also noted significantly more often in cases that presented with metastatic disease than those that had not. Increased TNF staining was associated with extensive coagulative tumour necrosis (≥90%), but only in samples obtained after administration of adjuvant therapy (Table 5B).
Table 4.
Macrophage migration inhibitory factor and tumour necrosis factor immunohistochemistry scores in chemotherapy naïve high-grade osteosarcoma samples*
| A. | ||||
|---|---|---|---|---|
| MIF-negative | Weak MIF | Strong MIF | P-value | |
| Stage | ||||
| Stage II (n = 57) | 29 (51%) | 10 (18%) | 18 (32%) | 0.082 |
| Stage IV (n = 8) | 1 (13%) | 3 (38%) | 4 (50%) | |
| Tumour necrosis | ||||
| <90% (n = 30) | 11 (37%) | 5 (17%) | 14 (47%) | 0.23 |
| ≥90% (n = 26) | 12 (46%) | 7 (27%) | 7 (27%) | |
| Ki-67 index (%) | 10.8 ± 13.2 | 14.7 ± 15.5 | 10.8 ± 10.7 | 0.49 |
| B. | ||||
|---|---|---|---|---|
| TNF-negative | Weak TNF | Strong TNF | P-value | |
| Stage | ||||
| Stage II (n = 58) | 31 (54%) | 10 (17%) | 17 (29%) | 0.47 |
| Stage IV (n = 8) | 5 (63%) | 2 (25%) | 1 (13%) | |
| Tumour necrosis | ||||
| <90% (n = 32) | 18 (56%) | 7 (22%) | 7 (22%) | 0.59 |
| ≥90% (n = 26) | 14 (54%) | 3 (12%) | 9 (35%) | |
| Ki-67 index (%) | 11.5 ± 12.5 | 11.0 ± 10.7 | 9.4 ± 11.6 | 0.60 |
Ki-67 indices were compared using Spearman’s rank correlation. All other groups were compared using the Kruskal–Wallis test.
Table 5.
Macrophage migration inhibitory factor and tumour necrosis factor immunohistochemistry scores in high-grade osteosarcoma resection specimens following neoadjuvant therapy*
| A. | ||||
|---|---|---|---|---|
| MIF-negative | Weak MIF | Strong MIF | P-value | |
| Stage | ||||
| Stage II (n = 61) | 22 (36%) | 12 (20%) | 27 (44%) | 0.015 |
| Stage IV (n = 6) | 0 (0%) | 0 (0%) | 6 (100%) | |
| Tumour necrosis | ||||
| <90% (n = 44) | 12 (27%) | 8 (18%) | 24 (55%) | 0.15 |
| ≥90% (n = 13) | 7 (54%) | 1 (8%) | 5 (38%) | |
| Ki-67 index (%) | 2.20 ± 5.77 | 5.29 ± 6.55 | 8.44 ± 7.72 | 0.0001 |
| B. | ||||
|---|---|---|---|---|
| TNF-negative | Weak TNF | Strong TNF | P-value | |
| Stage | ||||
| Stage II (n = 58) | 19 (33%) | 9 (15%) | 30 (52%) | 0.13 |
| Stage IV (n = 6) | 2 (33%) | 4 (66%) | 0 (0%) | |
| Tumour necrosis | ||||
| <90% (n = 43) | 17 (40%) | 11 (25%) | 15 (35%) | 0.005 |
| ≥90% (n = 12) | 1 (8%) | 1 (8%) | 10 (83%) | |
| Ki-67 index (%) | 5.17 ± 5.46 | 9.04 ± 7.33 | 5.20 ± 8.44 | 0.40 |
Ki-67 indices were compared using Spearman’s rank correlation. All other groups were compared using the Kruskal–Wallis test.
MIF and TNF as prognostic markers: survival analysis
Median duration of follow-up for the entire study group was 30 months (range: 1–157 months), during which time 20 patients died of disease (median length of survival 26 months, range: 7–60 months). An additional seven patients died from complications of surgical or adjuvant therapy and were censored in survival analyses. 42 patients developed metastatic disease during the follow-up interval (median interval to metastasis, 16 months; range 1–76 months). The median interval to local recurrence was 11 months (n = 28; range 2–117 months). Overall survival at 5 and 10 years was 68% at both time points (median: >157 months). Metastasis-free survival at 5 and 10 years was 42% and 37%, respectively (median: 32 months).
Log rank tests performed on Kaplan–Meier survival curves disclosed significant differences in overall (P < 0.001) and metastasis-free survival (P = 0.011) according to the TNF staining index of chemotherapy naïve specimens (Figure 5). The association between weak TNF staining and poor prognosis was also observed for specimens sampled after administration of adjuvant therapy (Table 6). Tumour stage was the only other prognostic parameter to reach statistical significance for overall survival in both pre-treatment (P < 0.0001) and post-treatment tumour samples (P = 0.005). MIF status was not associated with significant differences in either overall or metastasis-free survival (Table 6).
Figure 5.
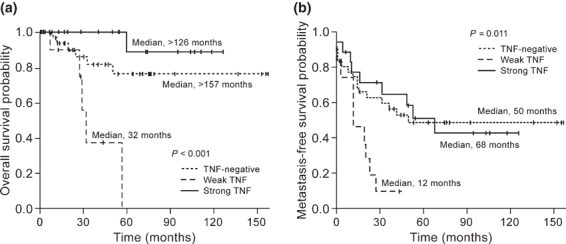
Kaplan–Meier overall (a) and metastasis-free (b) survival curves according to immunohistochemical staining index for tumour necrosis factor in high-grade osteosarcoma samples prior to administration of cytotoxic therapy.
Table 6.
Univariate survival analysis of osteogenic sarcoma according to immunohistochemistry scores for tumour necrosis factor and macrophage migration inhibitory factor and other clinicopathologic factors
| Chemotherapy naïve |
Post-adjuvant chemotherapy |
|||
|---|---|---|---|---|
| 5 year OS | Median MFS (months) | 5 year OS | Median MFS (months) | |
| TNF | P<0.001 | P=0.011 | P=0.033 | P<0.0001 |
| Negative | 76% | 50 | 63% | 19 |
| Weak | 0% | 12 | 42% | 10 |
| Strong | 89% | 68 | 76% | 76 |
| MIF | P=0.71 | P=0.28 | P=0.13 | P=0.31 |
| Negative | 72% | 68 | 76% | 32 |
| Weak | 71% | 32 | 36% | >156 |
| Strong | 78% | 15 | 69% | 15 |
| Age | P=0.85 | P=0.26 | P=0.17 | P=0.026 |
| ≤21 years | 69% | 32 | 46% | 19 |
| >21 years | 75% | 68 | 83% | >157 |
| Sex | P=0.57 | P=0.38 | P=0.34 | P=0.82 |
| Male | 71% | 28 | 68% | 28 |
| Female | 74% | 50 | 58% | 37 |
| Histologic type | P=0.66 | P=0.70 | P=0.66 | P=0.86 |
| Osteoblastic | 75% | 32 | 60% | 25 |
| Fibroblastic | 60% | 53 | 83% | 53 |
| Chondroblastic | 64% | 26 | * | 32 |
| Other types | 100% | 19 | 67% | 13 |
| Anatomic site | P=0.28 | P=0.84 | P=0.41 | P=0.061 |
| Appendicular | 73% | 37 | 65% | 24 |
| Axial/pelvic | 65% | 68 | 67% | >157 |
| Tumour necrosis | P=0.055 | P=0.071 | P=0.17 | P=0.21 |
| <90% | 59% | 15 | 62% | 16 |
| ≥90% | 81% | 53 | 75% | 53 |
| Ki-67 index | P=0.82 | P=0.52 | P=0.046 | P=0.36 |
| 0 | 89% | >126 | 66% | 50 |
| 1-5 | 66% | 37 | 100% | 20 |
| 6–15 | 75% | 21 | 46% | 13 |
| >15 | 61% | 32 | 67% | 28 |
| Tumour stage | P<0.0001 | NA | P=0.005 | NA |
| Stage II | 76% | 50 | 67% | 32 |
| Stage IV | 0% | NA | 27% | NA |
OS, overall survival; MFS, metastasis-free survival; NA, not applicable. *100% of patients were alive 55 months after diagnosis.
Subsequent Cox proportional hazards regression analysis confirmed that weak staining for TNF is an independent prognostic factor for decreased overall and metastasis-free survival in OGS prior to administration of adjuvant therapy (Table 7). Weak staining for TNF was also independently associated with decreased metastasis-free survival in samples taken from resection specimens after administration of adjuvant therapy. Strong TNF staining was associated with increased metastasis-free survival in post-treatment specimens, but not in chemotherapy naïve OGS samples. None of the variables included in the regression model for overall survival for OGS cases sampled after adjuvant therapy reached statistical significance.
Table 7.
Multivariate Cox proportional hazards regression model of overall and metastasis-free survival in 67 cases of chemotherapy naïve high-grade osteosarcoma and 67 cases of high-grade osteosarcoma after administration of cytotoxic therapy
| Chemotherapy naïve |
Post-adjuvant chemotherapy |
|||||
|---|---|---|---|---|---|---|
| HR | 95% CI | P-value | HR | 95% CI | P-value | |
| Overall survival | ||||||
| Weak TNF vs. negative | 7.62 | 1.71–33.9 | 0.0077 | 1.95 | 0.37–10.4 | 0.43 |
| Strong TNF vs. negative | 0.37 | 0.04–3.26 | 0.37 | 0.65 | 0.17–2.44 | 0.52 |
| Stage IV vs. Stage II | 94.1 | 7.06–1253.0 | <0.001 | 2.38 | 0.42–13.5 | 0.33 |
| Tumour necrosis* | 0.67 | 0.15–2.88 | 0.59 | NA | ||
| Ki-67 index | NA | 1.06 | 0.99–1.14 | 0.10 | ||
| Metastasis-free survival | ||||||
| Weak TNF vs. negative | 2.58 | 1.10–6.02 | 0.029 | 2.99 | 1.21–7.38 | 0.018 |
| Strong TNF vs. negative | 0.84 | 0.34–2.04 | 0.69 | 0.36 | 0.15–0.83 | 0.017 |
| Tumour necrosis* | 0.57 | 0.28–1.19 | 0.14 | NA | ||
| Age† | NA | 0.85 | 0.40–1.82 | 0.67 | ||
| Anatomic location‡ | NA | 2.58 | 0.94–7.14 | 0.066 | ||
HR, hazard ratio; CI, confidence interval; NA, not applicable.
‘Good response’ (≥90% tumour necrosis) vs. ‘poor response’ (<90% tumour necrosis).
Pediatric cases (≤21 years of age) vs. adult cases (>21 years of age).
Appendicular skeleton vs. axial/pelvic location.
Discussion
Molecular biomarkers that prospectively identify those OGS patients at highest risk for pulmonary metastasis would be clinically useful (Clark et al. 2008; Hayden & Hoang 2006; Marina et al. 2004). Furthermore, differences in protein expression patterns between metastatic and non-metastatic OGS cells might reflect aberrant cellular signalling networks and represent possible molecular therapeutic targets (Wang, 2005). Although several candidate genes indicative of increased metastatic potential have been identified in cDNA microarray analyses of OGS, there is minimal overlap among the gene expression signatures reported (Leonard et al. 2003; Nakano et al. 2003; Khanna et al. 2004; Clark et al. 2008). This is most likely a reflection of the different types of tumour samples, assay platforms, and statistical analyses employed (Leonard et al. 2003; Nakano et al. 2003). Therefore, considering the effects of post-transcriptional regulation and post-translational modification on protein expression patterns, it was not unanticipated that proteomic profiling would also identify a unique set of gene products in OGS cells with increased metastatic potential.
The clonally-related murine OGS cell lines developed by Khanna et al. (2000) differ markedly in their metastatic potentials and are useful models by which to study the process of metastasis. Combination cell profiling by MALDI-MS and 2D-DIGE allowed comprehensive evaluation of the K12 and K7M2 cellular proteomes across a broad molecular weight range (4–150 kDa). Distinct differences in protein expression patterns were identified in the highly metastatic OGS cell line K7M2 compared to the parental K12 OGS cell line. Bioinformatic molecular network analyses of the 20 proteins differentially expressed in K7M2 cells identified several additional candidate molecules that potentially predict metastatic potential, including the signalling molecules TNF, epidermal growth factor, hepatocyte growth factor, and prolactin.
MIF and TNF were selected for further study because these cytokines are important in tumour biology, are measurable in serum as potential biomarkers, and are susceptible to pharmacologic inhibition. TNF, one of the prototypical members of the TNF superfamily, is known to modulate the inflammatory response and have profound and complex effects on tumorigenesis and disease progression (Anderson et al. 2004; Szlosarek et al. 2006; Balkwill 2009; Brown et al. 2008; Mocellin & Nitti 2008; Sethi et al. 2008). MIF is a T-cell-derived lymphokine that activates and enhances tumoricidal activity of macrophages. Despite these properties, however, there is evidence that MIF promotes tumour growth by inhibition of apoptosis in a p53-dependent manner and by increasing angiogenic potential (Nishihira et al. 2003; Mitchell 2004; Sun et al. 2005; Oda et al. 2008). Reports implicating a role for MIF in human neoplasia (Ren et al. 2006; Denz et al. 2009) have prompted evaluation of MIF inhibitors as potential anti-neoplastic agents (Ogawa et al. 2000; Meyer-Siegler et al. 2006).
Increased expression of both MIF and TNF were confirmed in K7M2 cells in vitro, but only TNF status was an independent predictor of decreased metastasis-free and overall survival in validation studies using a human OGS TMA. In chemotherapy naïve samples, low levels of TNF were associated with poor prognosis, whereas the outcomes of patients with strong TNF expression were not significantly different from those with TNF-negative OGS. A similar pattern was observed for metastasis-free survival in specimens after administration of adjuvant therapy, except that in these cases strong TNF was independently associated with decreased risk of metastasis compared to TNF-negative OGS. Thus, the relationship between TNF expression and prognosis is complex.
Classically, TNF is considered as an anticancer agent. However, in animal models and human clinical trials, administration of pharmacological doses of TNF is required to achieve an antitumoral effect (Havell et al. 1988). Induction of hemorrhagic tumour necrosis by TNF is likely mediated by activation of the immune system and vascular thrombosis (Szlosarek & Balkwill 2003). By contrast, chronic TNF production is a feature of many tumours and ample preclinical evidence now implicate endogenous, low-level TNF in tumour development and metastasis (Szlosarek & Balkwill 2003). For example, knockdown of low-level TNF expression in human ovarian cancer lines virtually abolishes growth of tumour xenografts in vivo without altering the in vitro proliferation rate (Kulbe et al. 2007). Recently, our group utilized three different mouse tumour models to show that whereas high levels of tumour-derived TNF either inhibited or had little impact on tumour growth, low levels of TNF resulted in >6-fold increase in tumour volume, in part through its impact on modulating the phenotype of host bone marrow-derived cells (Li et al. 2009). The precise mechanism(s) of tumour promotion by low, endogenous levels of TNF are not yet understood. Regardless, the growing body of evidence implicating TNF in tumour promotion has led to clinical trials using FDA-approved TNF inhibitors in human cancer (Madhusudan et al. 2004, 2005).
Several reasons may account for the discrepancy between increased MIF expression in K7M2 cells and the lack of prognostic significance of IHC staining indices in human OGS tissue samples. Although differences in the distribution of MIF IHC scores among different specimen types were negligible when all cases were analysed together, pairwise statistical analysis demonstrated that MIF scores were significantly higher in recurrent and metastatic tumour samples compared to primary resection specimens. That MIF levels are significantly increased in highly metastatic K7M2 cells and in metastatic human OGS samples, but not in parental K12 cells or primary OGS tumours suggests that upregulation of MIF is a consequence of tumour progression, and not a causative factor in determining metastatic potential. Therefore, although increased in metastatic tumours, MIF is not useful as a predictive marker in primary tumour specimens.
A disadvantage of using murine OGS cell cultures as a model system is that microenvironmental conditions may not be adequately replicated in vitro. For example, tumour cells in culture are not exposed to endogenous extracellular matrices, tumour microvasculature, or other tumour-host tissue interactions (Clark et al. 2008). In addition, physical forces such as interstitial pressure may also be an important determinant of protein expression in OGS tumour cells (Diresta et al. 2005; Nathan et al. 2008). These explanations notwithstanding, other investigators have suggested that increased MIF expression is indeed associated with decreased overall and metastasis-free survival in OGS (Han et al. 2008). Critical differences in the experimental methodology as well as inherent differences in the patient cohorts likely account for this disparity. Further studies may be warranted to clarify the utility of MIF for prognosis in OGS.
Proteomic analysis of murine OGS cell lines disclosed several differences in the protein expression patterns between clones of different metastatic potential. Bioinformatic network analysis implicated several other proteins, including TNF, which might also be predictive of metastatic potential. Survival analyses of human OGS confirmed that differential expression of TNF, but not MIF, is associated with increased risk of death and metastasis independent of other clinicopathologic factors in a multivariate regression model.
Acknowledgments
K12 and K7M2 murine OGS cell lines were generously provided by Dr Lee Helman (National Institute of Diabetes and Digestive and Kidney Diseases, Pediatric Oncology Branch, National Cancer Institute, National Institutes of Health, Bethesda, MD, USA). The authors are deeply indebted to Dr Adriana Gonzalez (Department of Pathology, Vanderbilt University Medical Center) and Dr Nicole Muscato (Pathology Consultants of New London) for providing the osteogenic sarcoma TMA slides and corresponding clinicopathologic data used in this study. The authors thank Melissa Downing, Doha Itani, M.D., Brent Whited, M.D., and Clayton Wilburn for technical assistance. The editorial assistance of Lesley Albert and Jean McClure is also much appreciated.
This work was supported in part by the National Institute of Health and the National Institute of General Medical Sciences under NIH/NIGMS 5RO1GM58008 (RMC). Access to core facilities was supported by National Institutes of Health Grant P30 CA68485 (Vanderbilt-Ingram Cancer Center).
References
- Allred DC, Clark GM, Elledge R, et al. Association of p53 protein expression with tumor cell proliferation rate and clinical outcome in node-negative breast cancer. J. Natl Cancer Inst. 1993;85:200–206. doi: 10.1093/jnci/85.3.200. [DOI] [PubMed] [Google Scholar]
- Anderson GM, Nakada MT, DeWitte M. Tumor necrosis factor-alpha in the pathogenesis and treatment of cancer. Curr. Opin. Pharmacol. 2004;4:314–320. doi: 10.1016/j.coph.2004.04.004. [DOI] [PubMed] [Google Scholar]
- Balkwill F. Tumour necrosis factor and cancer. Nat. Rev. Cancer. 2009;9:361–371. doi: 10.1038/nrc2628. [DOI] [PubMed] [Google Scholar]
- Brown ER, Charles KA, Hoare SA, et al. A clinical study assessing the tolerability and biological effects of infliximab, a TNF-alpha inhibitor, in patients with advanced cancer. Ann. Oncol. 2008;19:1340–1346. doi: 10.1093/annonc/mdn054. [DOI] [PubMed] [Google Scholar]
- Caldwell RL, Caprioli RM. Tissue profiling by mass spectrometry: a review of methodology and applications. Mol. Cell Proteomics. 2005;4:394–401. doi: 10.1074/mcp.R500006-MCP200. [DOI] [PubMed] [Google Scholar]
- Clark JC, Dass CR, Choong PF. A review of clinical and molecular prognostic factors in osteosarcoma. J. Cancer Res. Clin. Oncol. 2008;134:281–297. doi: 10.1007/s00432-007-0330-x. [DOI] [PubMed] [Google Scholar]
- Cvetkovic I, Stosic-Grujicic S. Neutralization of macrophage migration inhibitory factor-novel approach for the treatment of immunoinflammatory disorders. Int. Immunopharmacol. 2006;6:1527–1534. doi: 10.1016/j.intimp.2006.06.009. [DOI] [PubMed] [Google Scholar]
- Dabideen DR, Cheng KF, Aljabari B, Miller EJ, Pavlov VA, Al-Abed Y. Phenolic hydrazones are potent inhibitors of macrophage migration inhibitory factor proinflammatory activity and survival improving agents in sepsis. J. Med. Chem. 2007;50:1993–1997. doi: 10.1021/jm061477+. [DOI] [PMC free article] [PubMed] [Google Scholar]
- Decker ED, Zhang Y, Cocklin RR, Witzmann FA, Wang M. Proteomic analysis of differential protein expression induced by ultraviolet light radiation in HeLa cells. Proteomics. 2003;3:2019–2027. doi: 10.1002/pmic.200300473. [DOI] [PubMed] [Google Scholar]
- Denz A, Pilarsky C, Muth D, Ruckert F, Saeger HD, Grutzmann R. Inhibition of MIF leads to cell cycle arrest and apoptosis in pancreatic cancer cells. J. Surg. Res. 2009 doi: 10.1016/j.jss.2009.03.048. May 3. [Epub ahead of print] doi: http://dx.doi.org/10.1016/j.jss.2009.03.048. [DOI] [PubMed] [Google Scholar]
- Diresta GR, Nathan SS, Manoso MW, et al. Cell proliferation of cultured human cancer cells are affected by the elevated tumor pressures that exist in vivo. Ann. Biomed. Eng. 2005;33:1270–1280. doi: 10.1007/s10439-005-5732-9. [DOI] [PubMed] [Google Scholar]
- Friedman DB, Hill S, Keller JW, et al. Proteome analysis of human colon cancer by two-dimensional difference gel electrophoresis and mass spectrometry. Proteomics. 2004;4:793–811. doi: 10.1002/pmic.200300635. [DOI] [PubMed] [Google Scholar]
- Friedman DB, Wang SE, Whitwell CW, Caprioli RM, Arteaga CL. Multivariable difference gel electrophoresis and mass spectrometry: a case study on transforming growth factor-beta and ERBB2 signaling. Mol. Cell Proteomics. 2007;6:150–169. doi: 10.1074/mcp.D600001-MCP200. [DOI] [PubMed] [Google Scholar]
- Garai J, Lorand T. Macrophage migration inhibitory factor (MIF) tautomerase inhibitors as potential novel anti-inflammatory agents: current developments. Curr. Med. Chem. 2009;16:1091–1114. doi: 10.2174/092986709787581842. [DOI] [PubMed] [Google Scholar]
- Gorlick R, Anderson P, Andrulis I, et al. Biology of childhood osteogenic sarcoma and potential targets for therapeutic development: meeting summary. Clin. Cancer Res. 2003;9:5442–5453. [PubMed] [Google Scholar]
- Han I, Lee MR, Nam KW, Oh JH, Moon KC, Kim HS. Expression of macrophage migration inhibitory factor relates to survival in high-grade osteosarcoma. Clin. Orthop. Relat. Res. 2008;466:2107–2113. doi: 10.1007/s11999-008-0333-1. [DOI] [PMC free article] [PubMed] [Google Scholar]
- Harrell FE., Jr Hmisc: Harrell miscellaneous. 2009. R package version 3.6-0. http://CRAN.R-project.org/package=Hmisc.
- Havell EA, Fiers W, North RJ. The antitumor function of tumor necrosis factor (TNF), I. Therapeutic action of TNF against an established murine sarcoma is indirect, immunologically dependent, and limited by severe toxicity. J. Exp. Med. 1988;167:1067–1085. doi: 10.1084/jem.167.3.1067. [DOI] [PMC free article] [PubMed] [Google Scholar]
- Hayden JB, Hoang BH. Osteosarcoma: basic science and clinical implications. Orthop. Clin. North Am. 2006;37:1–7. doi: 10.1016/j.ocl.2005.06.004. [DOI] [PubMed] [Google Scholar]
- Khanna C, Prehn J, Yeung C, Caylor J, Tsokos M, Helman L. An orthotopic model of murine osteosarcoma with clonally related variants differing in pulmonary metastatic potential. Clin. Exp. Metastasis. 2000;18:261–271. doi: 10.1023/a:1006767007547. [DOI] [PubMed] [Google Scholar]
- Khanna C, Wan X, Bose S, et al. The membrane-cytoskeleton linker ezrin is necessary for osteosarcoma metastasis. Nat. Med. 2004;10:182–186. doi: 10.1038/nm982. [DOI] [PubMed] [Google Scholar]
- Kulbe H, Thompson R, Wilson JL, et al. The inflammatory cytokine tumor necrosis factor-alpha generates an autocrine tumor-promoting network in epithelial ovarian cancer cells. Cancer Res. 2007;67:585–592. doi: 10.1158/0008-5472.CAN-06-2941. [DOI] [PMC free article] [PubMed] [Google Scholar]
- Leonard P, Sharp T, Henderson S, et al. Gene expression array profile of human osteosarcoma. Br. J. Cancer. 2003;89:2284–2288. doi: 10.1038/sj.bjc.6601389. [DOI] [PMC free article] [PubMed] [Google Scholar]
- Li B, Vincent A, Cates J, Brantley-Sieders DM, Polk DB, Young PP. Low levels of tumor necrosis factor alpha increase tumor growth by inducing an endothelial phenotype of monocytes recruited to the tumor site. Cancer Res. 2009;69:338–348. doi: 10.1158/0008-5472.CAN-08-1565. [DOI] [PMC free article] [PubMed] [Google Scholar]
- Madhusudan S, Foster M, Muthuramalingam SR, et al. A phase II study of etanercept (Enbrel), a tumor necrosis factor alpha inhibitor in patients with metastatic breast cancer. Clin. Cancer Res. 2004;10:6528–6534. doi: 10.1158/1078-0432.CCR-04-0730. [DOI] [PubMed] [Google Scholar]
- Madhusudan S, Muthuramalingam SR, Braybrooke JP, et al. Study of etanercept, a tumor necrosis factor-alpha inhibitor, in recurrent ovarian cancer. J. Clin. Oncol. 2005;23:5950–5959. doi: 10.1200/JCO.2005.04.127. [DOI] [PubMed] [Google Scholar]
- Marina N, Gebhardt M, Teot L, Gorlick R. Biology and therapeutic advances for pediatric osteosarcoma. Oncologist. 2004;9:422–441. doi: 10.1634/theoncologist.9-4-422. [DOI] [PubMed] [Google Scholar]
- Meier BW, Gomez JD, Zhou A, Thompson JA. Immunochemical and proteomic analysis of covalent adducts formed by quinone methide tumor promoters in mouse lung epithelial cell lines. Chem. Res. Toxicol. 2005;18:1575–1585. doi: 10.1021/tx050108y. [DOI] [PubMed] [Google Scholar]
- Meyer-Siegler KL, Iczkowski KA, Leng L, Bucala R, Vera PL. Inhibition of macrophage migration inhibitory factor or its receptor (CD74) attenuates growth and invasion of DU–145 prostate cancer cells. J. Immunol. 2006;177:8730–8739. doi: 10.4049/jimmunol.177.12.8730. [DOI] [PubMed] [Google Scholar]
- Mitchell RA. Mechanisms and effectors of MIF-dependent promotion of tumourigenesis. Cell. Signal. 2004;16:13–19. doi: 10.1016/j.cellsig.2003.07.002. [DOI] [PubMed] [Google Scholar]
- Mocellin S, Nitti D. TNF and cancer: the two sides of the coin. Front. Biosci. 2008;13:2774–2783. doi: 10.2741/2884. [DOI] [PubMed] [Google Scholar]
- Morand EF. New therapeutic target in inflammatory disease: macrophage migration inhibitory factor. Intern. Med. J. 2005;35:419–426. doi: 10.1111/j.1445-5994.2005.00853.x. [DOI] [PubMed] [Google Scholar]
- Nakano T, Tani M, Ishibashi Y, et al. Biological properties and gene expression associated with metastatic potential of human osteosarcoma. Clin. Exp. Metastasis. 2003;20:665–674. doi: 10.1023/a:1027355610603. [DOI] [PubMed] [Google Scholar]
- Nathan SS, Huvos AG, Casas-Ganem JE, et al. Tumor interstitial fluid pressure may regulate angiogenic factors in osteosarcoma. J. Orthop. Res. 2008;26:1520–1525. doi: 10.1002/jor.20633. [DOI] [PubMed] [Google Scholar]
- Nishihira J, Ishibashi T, Fukushima T, Sun B, Sato Y, Todo S. Macrophage migration inhibitory factor (MIF): Its potential role in tumor growth and tumor-associated angiogenesis. Ann. N Y Acad. Sci. 2003;1995:171–182. doi: 10.1111/j.1749-6632.2003.tb03220.x. [DOI] [PubMed] [Google Scholar]
- Oda S, Oda T, Nishi K, et al. Macrophage migration inhibitory factor activates hypoxia-inducible factor in a p53-dependent manner. PLoS ONE. 2008;3:e2215. doi: 10.1371/journal.pone.0002215. [DOI] [PMC free article] [PubMed] [Google Scholar]
- Ogawa H, Nishihira J, Sato Y, et al. An antibody for macrophage migration inhibitory factor suppresses tumour growth and inhibits tumour-associated angiogenesis. Cytokine. 2000;12:309–314. doi: 10.1006/cyto.1999.0562. [DOI] [PubMed] [Google Scholar]
- R Development Core Team R: A language and environment for statistical computing. R Foundation for Statistical Computing. 2009. http://www.R-project.org.
- Ren Y, Chan HM, Fan J, et al. Inhibition of tumor growth and metastasis in vitro and in vivo by targeting macrophage migration inhibitory factor in human neuroblastoma. Oncogene. 2006;25:3501–3508. doi: 10.1038/sj.onc.1209395. [DOI] [PubMed] [Google Scholar]
- Reyzer ML, Caldwell RL, Dugger TC, et al. Early changes in protein expression detected by mass spectrometry predict tumor response to molecular therapeutics. Cancer Res. 2004;64:9093–9100. doi: 10.1158/0008-5472.CAN-04-2231. [DOI] [PubMed] [Google Scholar]
- Schmidt J, Strauss GP, Schon A, et al. Establishment and characterization of osteogenic cell lines from a spontaneous murine osteosarcoma. Differentiation. 1988;39:151–160. doi: 10.1111/j.1432-0436.1988.tb00090.x. [DOI] [PubMed] [Google Scholar]
- Sethi G, Sung B, Aggarwal BB. TNF: a master switch for inflammation to cancer. Front. Biosci. 2008;13:5094–5107. doi: 10.2741/3066. [DOI] [PubMed] [Google Scholar]
- Sun B, Nishihira J, Yoshiki T, et al. Macrophage migration inhibitory factor promotes tumor invasion and metastasis via the rho-dependent pathway. Clin. Cancer Res. 2005;11:1050–1058. [PubMed] [Google Scholar]
- Szlosarek PW, Balkwill FR. Tumour necrosis factor alpha: a potential target for the therapy of solid tumours. Lancet Oncol. 2003;4:565–573. doi: 10.1016/s1470-2045(03)01196-3. [DOI] [PubMed] [Google Scholar]
- Szlosarek P, Charles KA, Balkwill FR. Tumour necrosis factor-alpha as a tumour promoter. Eur. J. Cancer. 2006;42:745–750. doi: 10.1016/j.ejca.2006.01.012. [DOI] [PubMed] [Google Scholar]
- Therneau T, Lumley T. survival: Survival analysis, including penalised likelihood. R package version 2.35-4. 2009. http://CRAN.R-project.org/package=survival.
- UniProt Consortium The Universal Protein Resource (UniProt) 2009. Nucleic Acids Res. 2009;37:D169–D174. doi: 10.1093/nar/gkn664. [DOI] [PMC free article] [PubMed] [Google Scholar]
- Wang LL. Biology of osteogenic sarcoma. Cancer J. 2005;11:294–305. doi: 10.1097/00130404-200507000-00005. [DOI] [PubMed] [Google Scholar]
- Xu BJ, Shyr Y, Liang X, et al. Proteomic patterns and prediction of glomerulosclerosis and its mechanisms. J. Am. Soc. Nephrol. 2005;16:2967–2975. doi: 10.1681/ASN.2005030262. [DOI] [PubMed] [Google Scholar]