Figure 3.

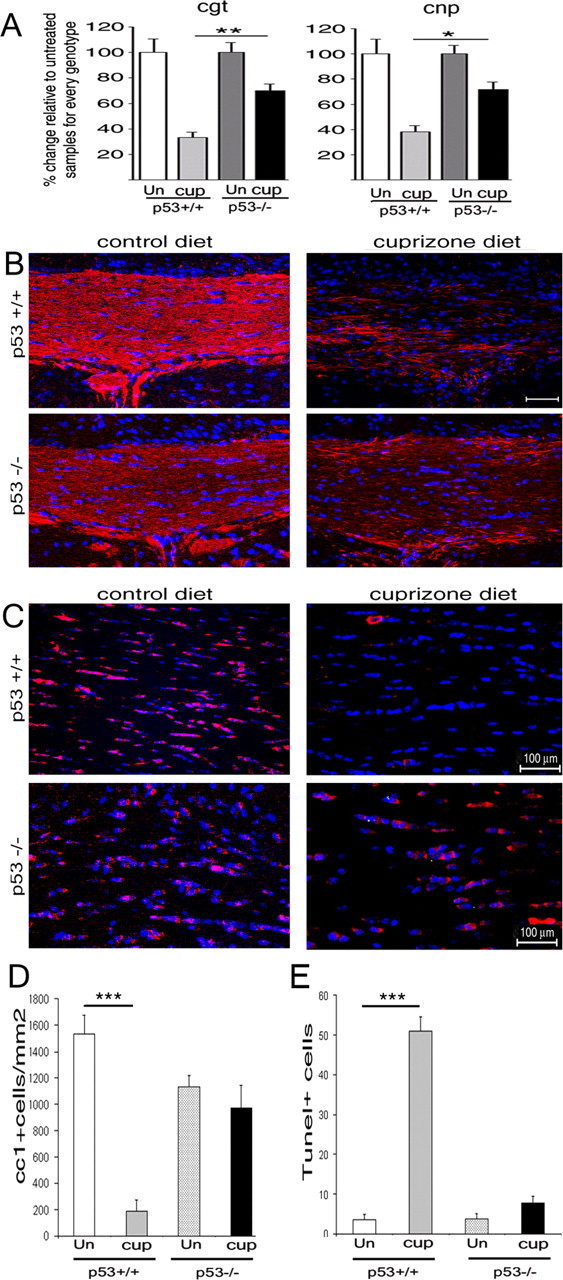
Increased oligodendrocyte survival and myelin sparing in mice lacking p53. A, Relative RNA levels of the myelin gene transcripts for cgt and cnp detected in the dorsal corpus callosum of p53+/+ and p53−/− mice after 4 weeks of feeding on a control or 0.2% cuprizone diet. The RNA levels in each sample were referred to the GAPDH levels, and the levels detected in the untreated animals were chosen as a reference point. Note the higher levels of myelin gene transcripts detected in cuprizone-treated p53−/− mice compared with treated wild-type siblings. *p < 0.05; **p < 0.01. Error bars indicate SEM. B, Confocal image of coronal brain sections of wild-type (p53+/+) and knock-out (p53−/−) siblings fed a control or cuprizone diet for 4 weeks and then stained with antibodies specific for MBP to identify myelinated fibers (red) and DAPI (blue) as nuclear counterstain. Scale bar, 50 μm. C, Confocal image of coronal brain sections of wild-type (p53+/+) and knock-out (p53−/−) siblings fed a control or a 0.2% cuprizone diet for 4 weeks and then stained with the CC1 antibody to identify oligodendrocytes (red) and DAPI (blue) as nuclear counterstain. D, Bar graphs indicate the relative number of CC1+ cells detected in the dorsal corpus callosum of p53+/+ and p53−/− mice receiving either control or 0.2% cuprizone diet. n = 3 animals per condition; ***p < 0.001. E, Bar graphs indicate the relative number of TUNEL+ cells detected in the dorsal corpus callosum of p53+/+ and p53−/− mice after 3 weeks of control or 0.2% cuprizone diet. n = 3 animals per condition; ***p < 0.001. Note that in p53−/− mice the difference in the number of CC1+ and TUNEL+ cells between the untreated and cuprizone-treated groups is not statistically significant. Un, Untreated (control); cup, cuprizone; TUNEL, terminal deoxynucleotidyl transferase-mediated biotinylated UTP nick end labeling.
