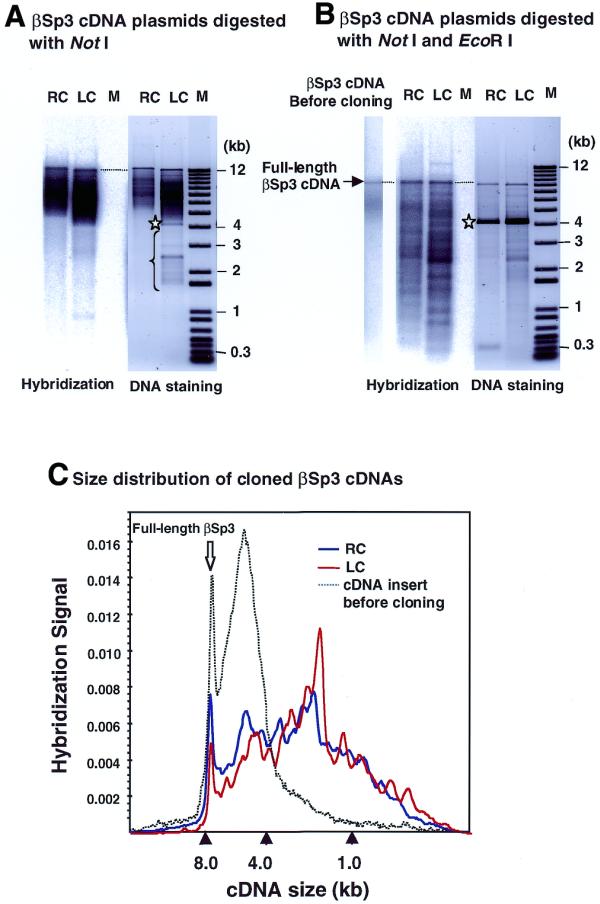
Figure 3.

Comparison of size bias effects imposed on cloning of a 7.8 kb βSp3 cDNA by LC and RC. RC and LC shown above lanes in (A) and (B) indicate recovered cDNA plasmids produced by RC and by LC, respectively. DNAs were separated on a 0.7% agarose gel, stained with SYBR-Green I, transferred onto a nylon membrane and hybridized with a 32P-labeled oligonucleotide probe specific to the 3′-end sequence of βSp3. (A) and (B) show the DNA staining patterns and the hybridization pattern of βSp3 cDNA plasmids digested with NotI and NotI plus EcoRI, respectively. In (B) the hybridization pattern of the gel-recovered βSp3 cDNA before cloning is also shown. Size marker DNAs (1 kb Plus DNA Ladder, Life Technologies) were run in lane M. (C) Distribution of hybridization signals along each lane of the gel-recovered βSp3 cDNA and cDNA plasmids in (B). Stars in (A) and (B) indicate the position of linearized pSPORT-1.
