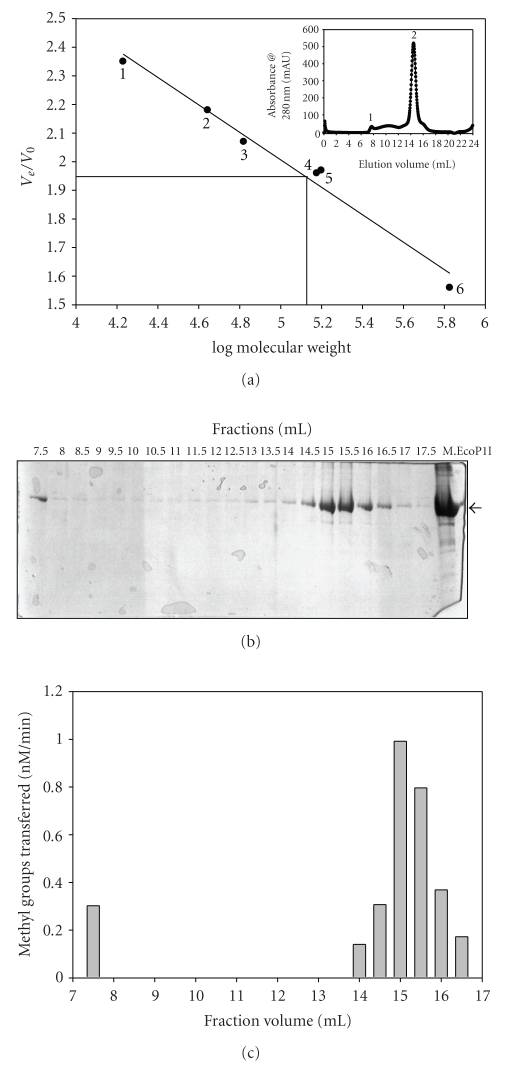
Figure 1.
Determination of the molecular mass of M.EcoP1I by size-exclusion chromatography under nondenaturing conditions. (a) The standard curve Ve/Vo versus log molecular weight was derived from the elution profiles of the standard molecular weight markers with Ve corresponding to the peak elution volume of the protein and Vo representing the void volume of the column determined using Blue dextran (2,000,000 kDa). The peak position of M.EcoP1I is indicated by a line: (1) horse myoglobin (17 kDa); (2) chicken ovalbumin (44 kDa); (3) bovine serum albumin (66 kDa); (4) M.EcoP15I (150 kDa); (5) γ-Globulin (158 kDa) and thyroglobulin (670 kDa). Inset: elution profile of M.EcoP1I. (b) Fractions were collected after gel-filtration chromatography and analyzed on SDS-PAGE for presence of M.EcoP1I. (c) Methylation activity of M.EcoP1I present in the fractions was checked using filter-binding assays.

