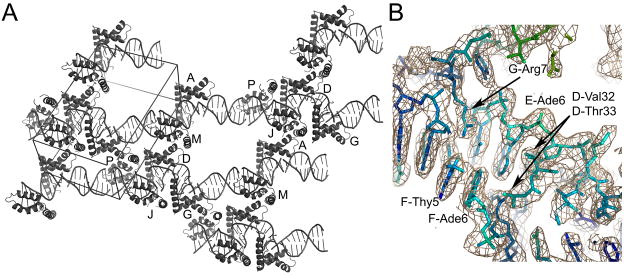
Figure 2.
Structure of the HMGDM13A -DNA complex. (A) Overall crystal packing diagram. The unit cell is shown with additional DNA from adjacent asymmetric units to illustrate the mode of packing within the crystal. The model contains six HMGDM13A proteins and five DNA decamers that are arranged in a continuous DNA helical stack throughout the crystal. (B) Electron density of a protein-DNA contact region. The σa-weighted 2Fo-Fc map contoured at 1.2 σ is shown in tan, with the underlying model colored according to the B-factor of the model, from blue (lowest B factors) to red (highest B-factors). Selected residues are labeled with the chain ID, residue number, and residue name for clarity.

