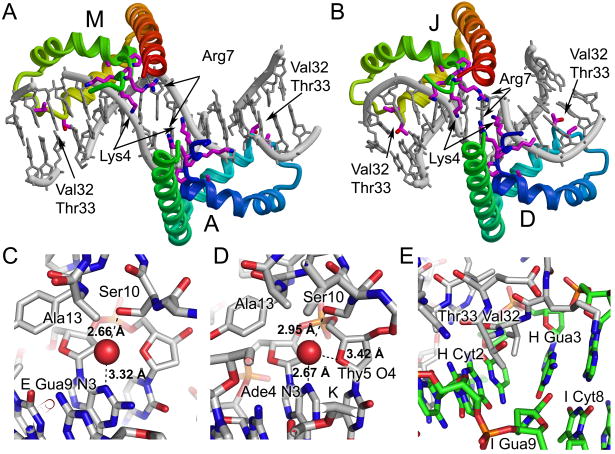
Figure 4.
Detailed views of protein DNA interactions. Two pairs of proteins form head-to-head interactions in the crystal. The binding sites of molecules A and M (A) and D and J (B) are shown with the protein colored with rainbow coloring from blue to red along each pair of HMG boxes from the N-terminus of domain A or D to the C-terminus of molecule M or J. The DNA is in grey. Amino acid residues Lys4, Pro5, Lys6, Arg7, Pro8, Ala13, Val32, and Thr33 are shown in stick form. (C) Close up views of the water mediated interaction of Ser10 with DNA purine bases are shown for (C) chains D-E/F and chains P-K/L. The stick diagram is colored with carbon in grey, oxygen in red, nitrogen in blue, phosphorus in orange, and with the water molecule shown as a red sphere. The putative hydrogen bonds are shown as black dotted lines with distances indicated. (E) A close up view of the intercalation by Val32 and Thr33 observed in chain G bound to chains H/I. The stick diagram is colored with carbon in grey for protein and in green for DNA, oxygen in red, nitrogen in blue and phosphorus in orange. The intercalation of Val32 and Thr33 occurs at the strand H Cyt2-Gua3 base step in the DNA.

