
Figure 5.
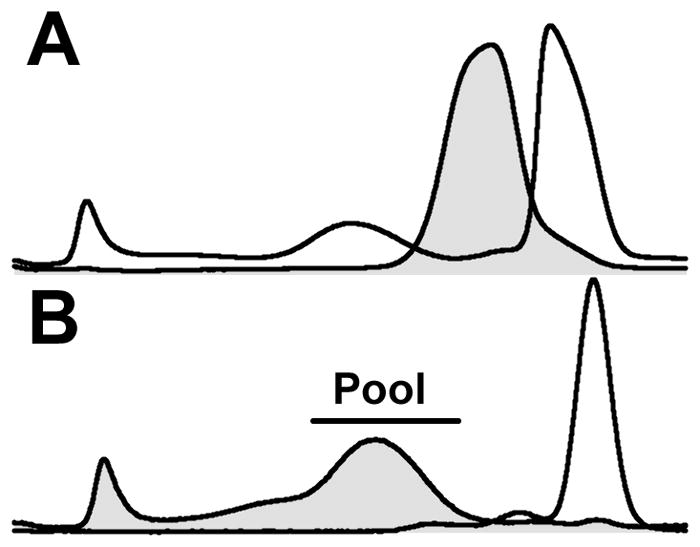
Effect of rSOF on Ultrastable HDL and rHDL. A: SEC profile of HDL before (filled curve) and after treatment (unfilled curve) with 6 M Gdm-Cl. B: SEC profile of the d < 1.21 g/mL (filled curve) and d > 1.21 g/mL fractions of HDL after treatment with 6 M Gdm-Cl; the horizontal bar indicates the ultrastable HDL pool. C. SEC profille of HDL (0.65 mg/mL) before (filled curve) and after (unfilled curve) treatment with rSOF (1 μg/mL for 3 hours). D. SEC profille of ultrastable HDL (0.65 mg/mL) before (filled curve) and after (unfilled curve) treatment with rSOF (1 μg/mL). E: SEC profiles of rHDL (0.5 mg/mL) before (filled curve) and after (unfilled curve) incubation with rSOF (1 μg/mL); difference between curves (dashed curve).