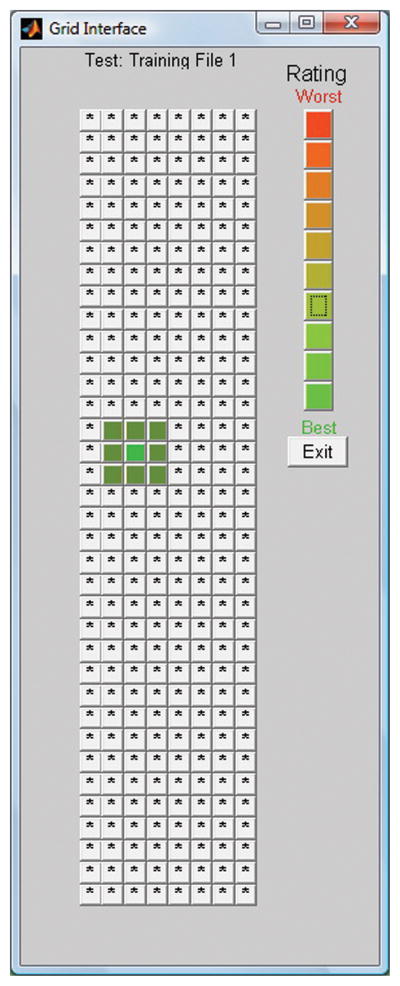
Figure 1.

A depiction of the graphical user interface that the CI patient sees when using Gridstream. Each square within the grid represents the same sentence processed with a different frequency table. When the frequency tables are not randomized, as the patient moves from left to right within the grid, the overall bandwidth (span) increases. Conversely, as one moves from top to bottom, the frequency range within a given span becomes higher in frequency. Listeners can rate the intelligibility of a given table by right-clicking on a given rating within the rating scale shown on the upper right of the grid.
