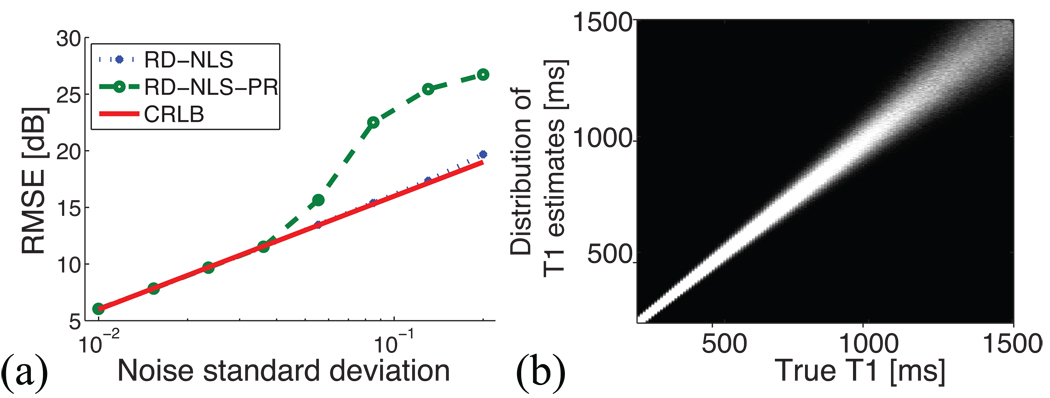
Figure 1.
Influence of SNR and T1. (a) RMSE of the T1 estimates using the complex data (RD-NLS) and the polarity-restored magnitude data (RD-NLS-PR), together with the CRLB, for different σn. (b) T1 estimates as a function of true T1 values. Each column gives a histogram of the T1 estimate distribution for a given true T1. The precision worsens as the true T1 increases.

