
Figure 1.
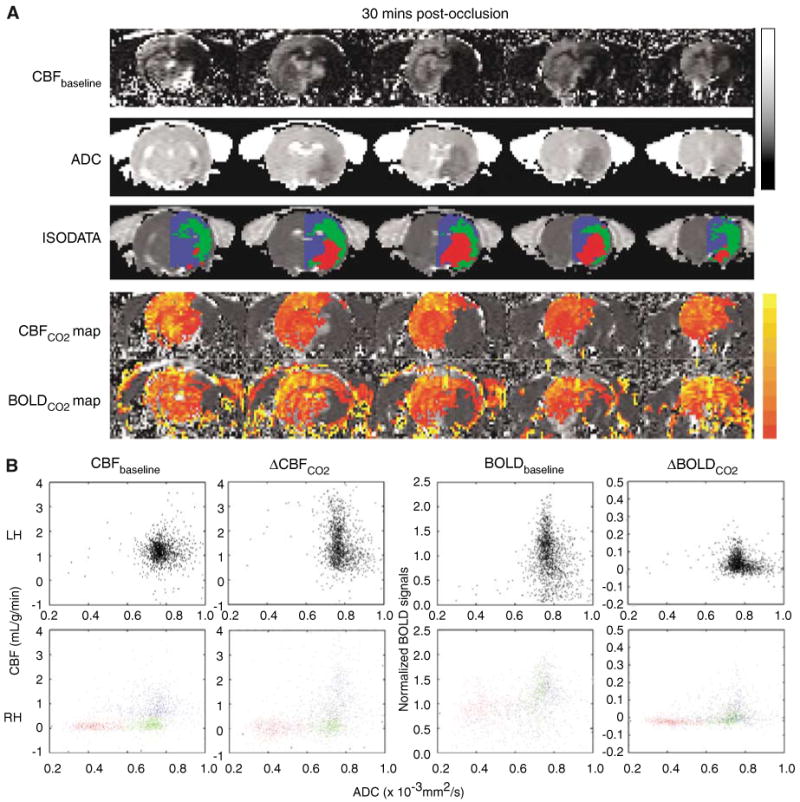

Permanent occlusion—CO2 functional magnetic resonance imaging (fMRI) responses in different ISODATA-derived clusters (n = 11). (A) Representative CBF and apparent diffusion coefficient (ADC) maps, ISODATA clusters overlaid on ADC maps, ΔCBFCO2 and ΔBOLDCO2 percent change maps overlaid on CBF images of a rat subjected to permanent focal ischemia at the 30-min time point. ISODATA cluster analysis yielded ‘normal’ (blue), ‘perfusion–diffusion mismatch’ (green), and ‘ischemic core’ (red) clusters. Gray-scale bar indicates ADC ranging from 0 to 0.001 mm2/sec and CBF 0 to 3 mL/g/min. Color bar indicates ΔCBF ranging from 10% to 400% and ΔBOLD 1% to 10%. (B) Scatterplots of baseline CBF versus ADC, ΔCBFCO2 versus ADC, normalized baseline -weighted signal intensities versus ADC, and ΔBOLDCO2 versus ADC for the left hemisphere (LH) and the right hemisphere (RH) at 30 mins after ischemia (one animal). ISODATA-derived clusters were assigned as ‘normal’ (blue), ‘perfusion–diffusion mismatch’ (green) and ‘ischemic core’ clusters (red). (C) Group-average baseline CBF, ΔCBFCO2, and ΔBOLDCO2 of the normal left hemisphere and the ISODATA-derived normal, mismatch, core clusters of the right ischemic hemisphere at three time points after ischemia. (D) Temporal evolution of the group-average baseline CBF, ΔCBFCO2, and ΔBOLDCO2 of the ‘mismatch’ before and after migration to different zones as ischemia progressed. Mismatch at 30 mins after ischemia was used as the reference and these mismatch pixels were tracked as they migrated to different zones at 180 mins after ischemia.