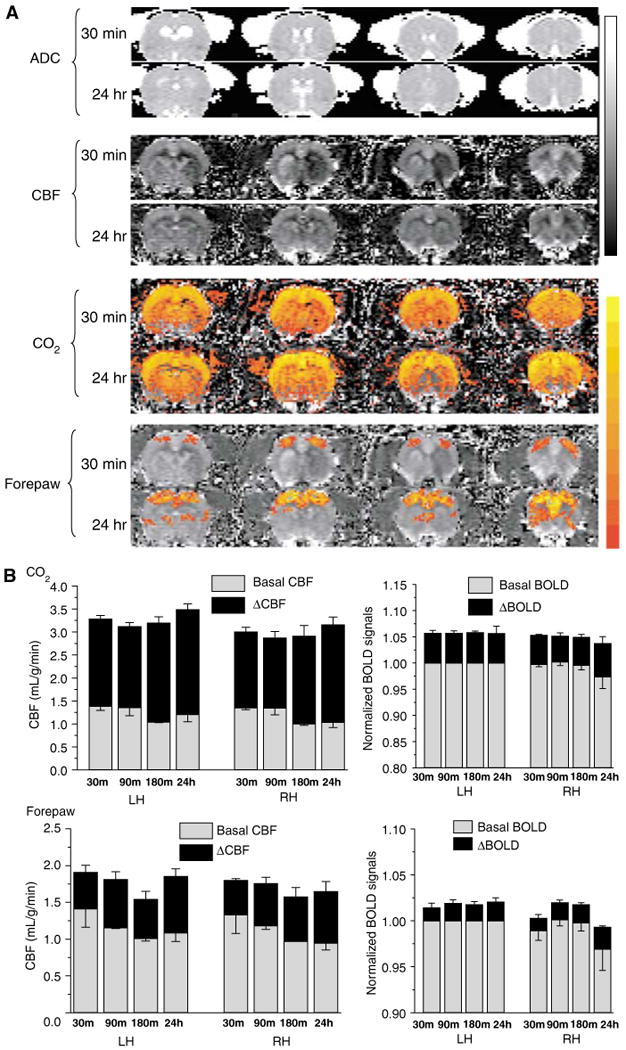
Figure 3.

Transient occlusion–CO2 and forepaw functional magnetic resonance imaging (fMRI) responses in the primary somatosensory cortices (n = 8). (A) Apparent diffusion coefficient (ADC) maps, baseline CBF, ΔCBFCO2, and forepaw stimulation ΔCBF of a rat subjected to transient ischemia. Gray-scale bar indicates ADC ranging from 0 to 0.001 mm2/sec and CBF 0 to 3 mL/g/min. Color bar indicates ΔCBF ranging from 10% to 400% and ΔBOLD 1% to 10%. (B) Group-average baseline CBF, ΔCBFCO2, and ΔBOLDCO2 of the normal left hemisphere (LH) and the right hemisphere (Rh) ISODATA-derived normal, mismatch, core clusters of the right ischemic hemisphere.
