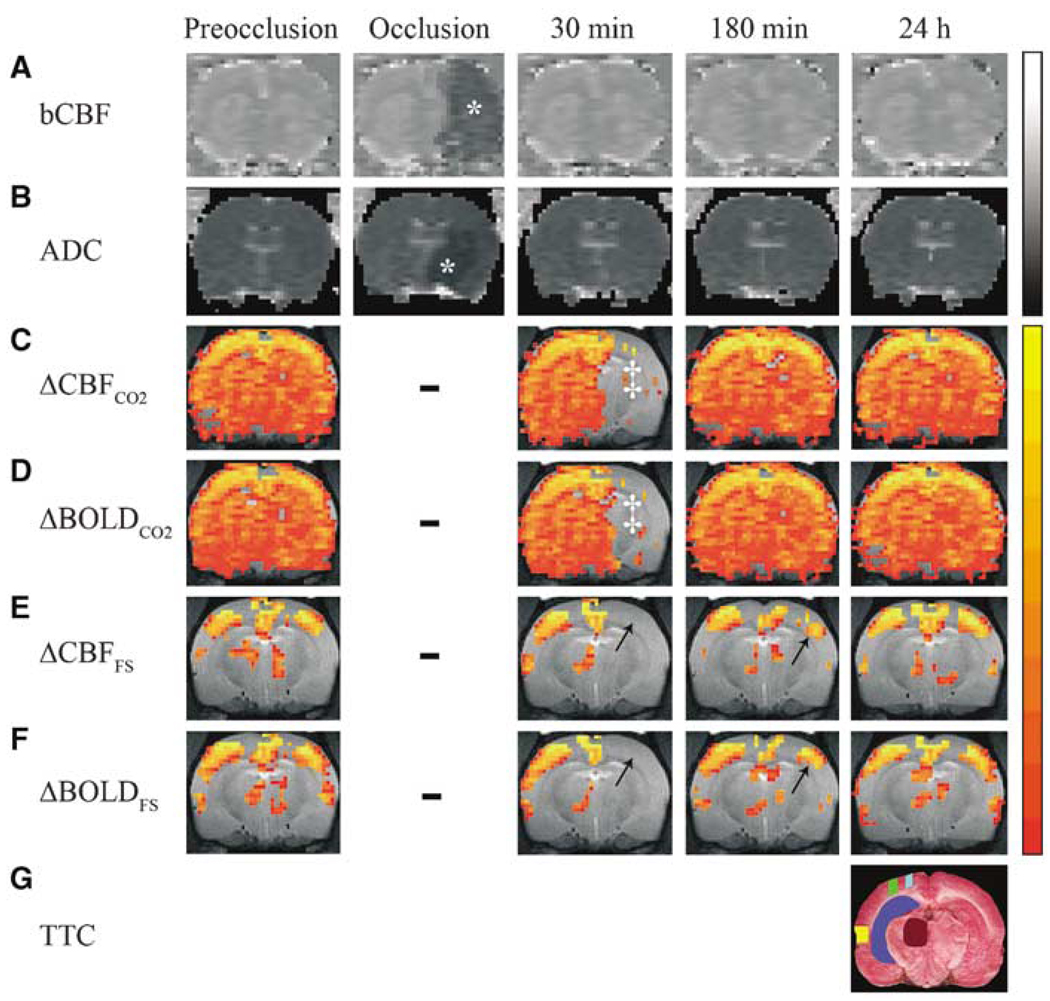
Figure 1.
Representative magnetic resonance (MR) and histological images of a 20-mins transient middle cerebral artery occlusion (tMCAO) rat at selected time points showing (A) basal cerebral blood flow (bCBF) (B) apparent diffusion coefficient (ADC), (C) ΔCBFCO2, (D) ΔBOLDCO2, (E) ΔCBFFS, and (F) ΔBOLDFS maps as well as (G) 2,3,5-triphenyltetrazolium chloride (TTC) staining. CO2 and FS subscripts refer to functional magnetic resonance imaging (fMRI) signal changes evoked by hypercapnic challenge and forepaw stimulation, respectively. Gray-scale bar indicates ADC ranging from 0 to 0.001 mm2/sec and bCBF from 0 to 3 mL/g/min. Color-scale bar indicates ΔCBF ranging from 10 to 200% and ΔBOLD from 1% to 5%. *ADC and CBF lesions. ‡Area of impaired response to 5% CO2. Arrows indicate impaired response to forepaw stimulation. Dashes indicate fMRI not performed during occlusion. Activation maps were overlaid on anatomic images, and a select slice (i.e., fourth-most anterior, corresponding to −2.12 mm from bregma) and percent-thresholds were chosen for visual clarity. ROIs overlaid on TTC are CPu (dark blue), M1 (light blue), thalamus (brown), Sf1 (green), and S2 (yellow).

