
FIG. 1.
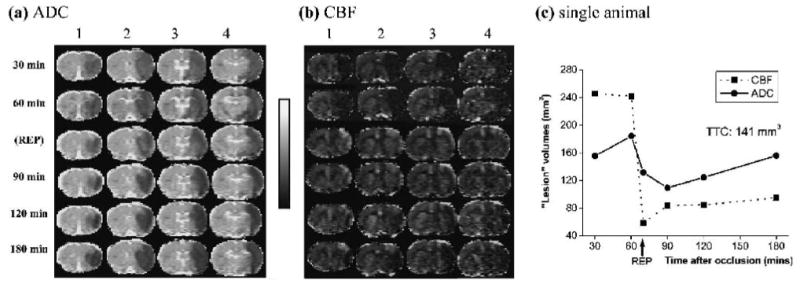
Representative (a) ADC and (b) CBF maps from one animal. Four of seven multislice ADCav and CBF maps are shown at 30, 60, immediately after reperfusion (labeled as REP at 70 minutes), 90, 120, and 180 minutes post-ischemia. The TTC infarct volume at 24 hours for this animal was 141 mm3. The grayscale bar indicates ADC ranges from 0 to 0.001 mm2/s and CBF ranges from - 1 to 2 mL/g/min. (c) Temporal progression of ADC- and CBF-defined lesion volumes determined by using the group-average viability thresholds (57% and 30% reduction for CBF and ADC thresholds, respectively), as previously determined (Shen et al., 2003).