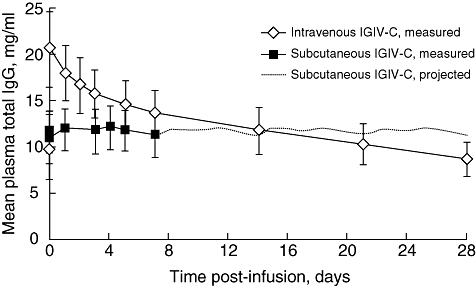
Fig. 2.

Steady-state plasma total immunoglobulin G (IgG) concentration-versus-time curves during intravenous or subcutaneous administration of immune globulin intravenous (human), 10% caprylate/chromatography purified (IGIV-C). Projected total IgG concentrations for subcutaneous IGIV-C (days 7–28) were based on measured concentrations over 0–7 days obtained during week 17 of the subcutaneous phase. Data are reported for the pharmacokinetic population and as mean ± standard error.
