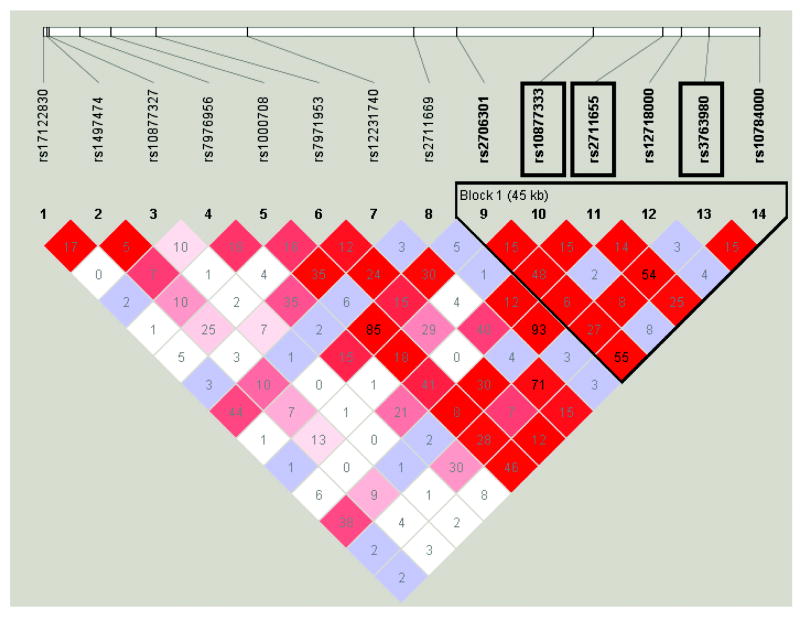
Figure 3. Linkage disequilibrium plot for SNPs across the SLC16A7 gene using Haploview version 4.1, showing LD block around the associated SNPs.
Significant SNPs highlighted in black boxes. Pairwise LD calculated using D', with the coloured squares showing the strength of LD, with red denoting high LD, blue moderate LD and white low LD. The numbers in the block denotes LD calculated using r2.

