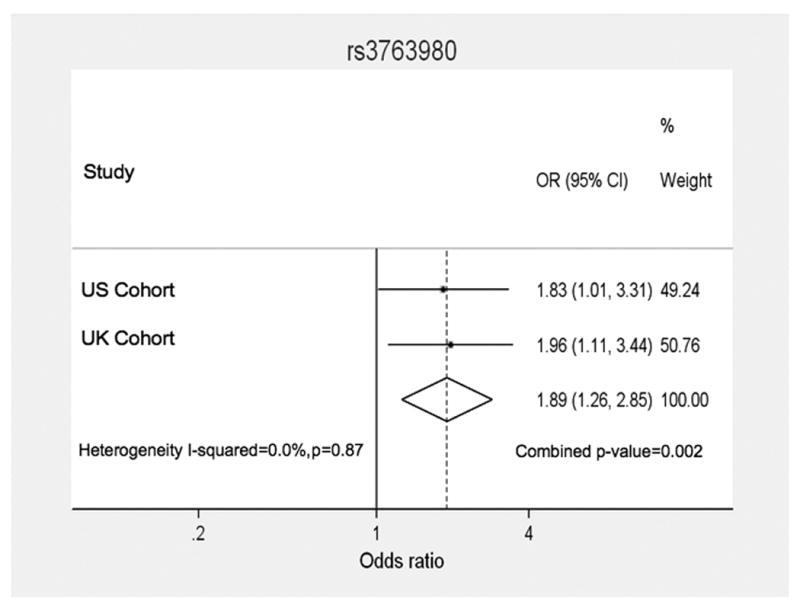
Figure 4. Meta-analysis of rs3763980 in UK CHARMS dataset and US dataset.

Forest plot displaying odds ratios (OR) and 95% confidence intervals for each of the two studies (US, UK) and the weighting for each study according to sample size. The combined OR (1.89) from the two studies is displayed as a diamond with the peaks denoting the upper and lower limits of the confidence intervals (1.26 – 2.85). The combined p-value for association of the A allele with non-responder status was 0.002. The Breslow-Day test was performed to test for heterogeneity between the two studies, and showed no evidence of heterogeneity (p=0.87).
