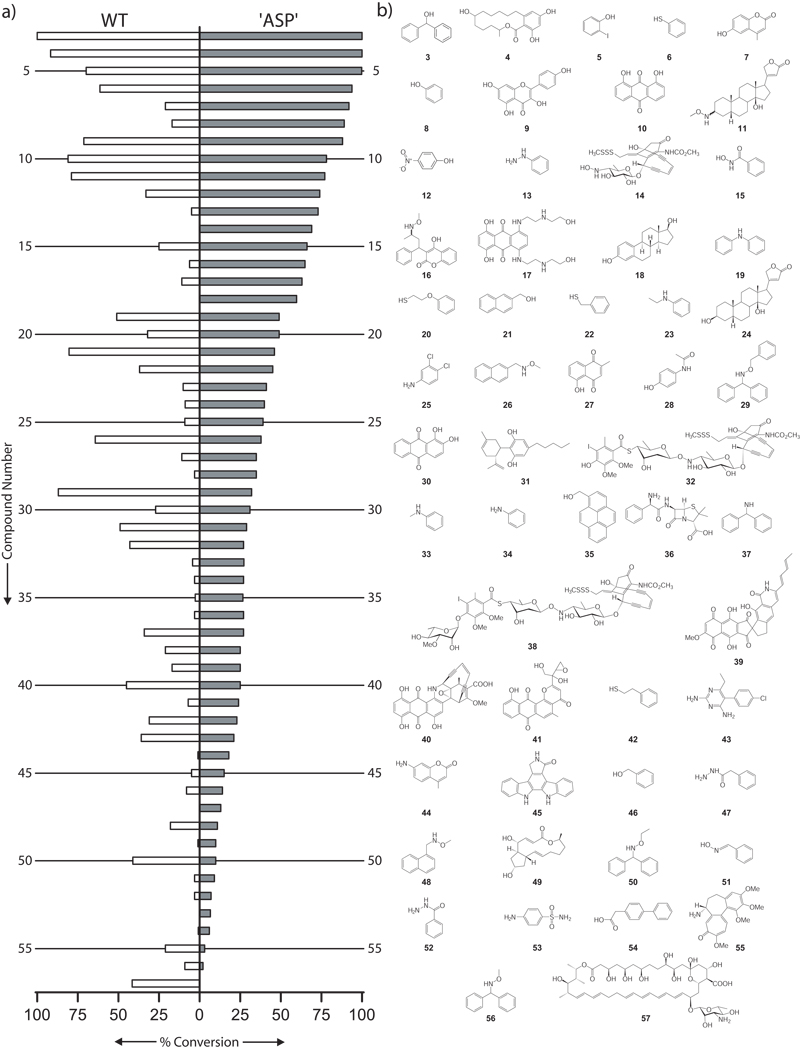
Figure 1.
a) Percent conversion of each library member with both WT and ‘ASP’ OleD. Members are listed in descending order of ‘ASP’ conversion with numbering corresponding to the structures listed in (b). b) Structures of the corresponding library members. Compounds leading to trace products (58–73, >5% conversion) or no conversion (74–139) are listed in the Supplementary Information.

