Figure 2.

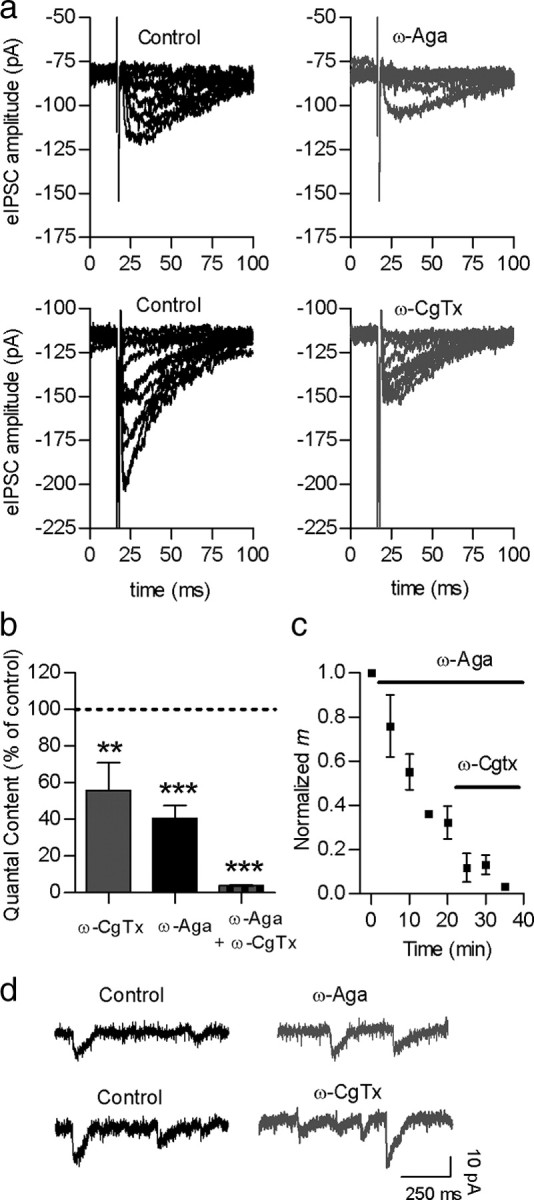
Both P/Q- and N-type VGCCs support transmitter release at the MOC–IHC synapse. a, Representative traces of eIPSCs recorded at a membrane potential of −90 mV before and after incubation with either 200 nm ω-Aga IVA or 300 nm ω-CgTx, specific antagonists of P/Q- and N-type VGCCs, respectively. b, Bar graph illustrating the effects on m of each of the toxins applied separately or at the same time. c, Graph showing that the sequential application of ω-Aga IVA and ω-CgTx almost completely abolished the release of ACh. d, Representative records of sIPSC before and after incubation with ω-Aga IVA (top) and ω-CgTx (bottom) show no change in sIPSC amplitude. Error bars are SEM. **p < 0.01, ***p < 0.001.
