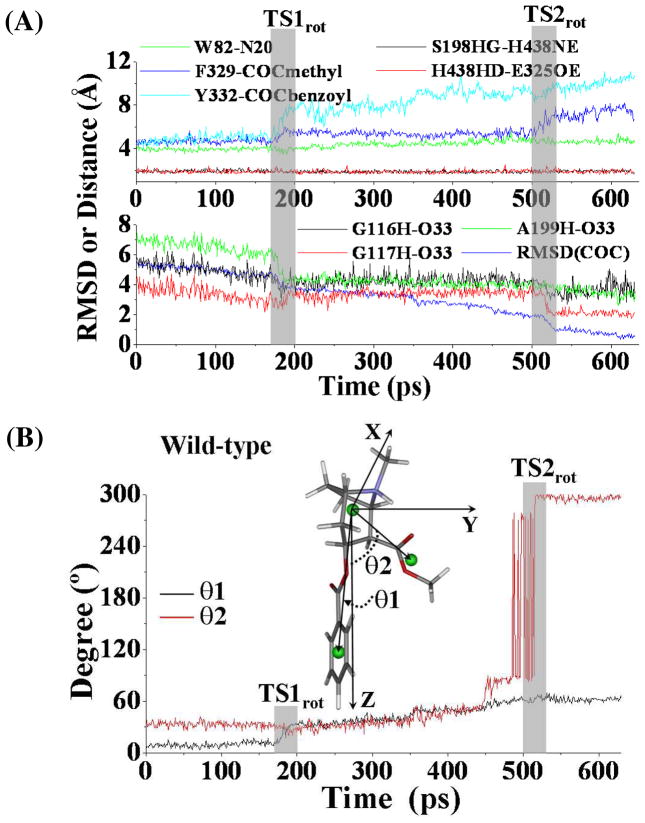
Figure 3.
(A) Tracked key distances and RMSD for (−)-cocaine molecule of wild-type BChE-(−)-cocaine binding structure along the TMD trajectory. W82-N20 represents the distance from the center of aromatic side chain of W82 to the nitrogen atom at the cationic head of (−)-cocaine; F329-COCmethyl represents the distance from the center of aromatic side chain of F329 to the center of methyl ester group of (−)-cocaine; Y332-COCbenzoyl means the distance from the center of aromatic side chain of Y332 to the center of benzoyl group of (−)-cocaine; G116H-O33 represents the distance between the backbone hydrogen of residue G116 to the carbonyl oxygen at the benzoyl ester of (−)cocaine, and similar meaning for distances as G117H-O33 and A199H-O33, respectively; S198HG-H438NE and H438HD-E325OE represent the distances of hydrogen bonding interactions within the catalytic triad residues S198-H438-E325 of the enzyme. TS1rot and TS2rot represent the transition states (shaded regions) for the transformation process. (B) Conformational change for (−)-cocaine molecule along the TMD trajectory. This is represented by the changes of the two angles (θ1, θ2). θ1 is the angle between the Z-axis and the vector pointing from the center of the cationic head to the center of benzoyl group of (−)-cocaine, and θ2 is the angle between the Z-axis and the vector starting from the cationic head to the center of methyl ester group of (−)-cocaine.

