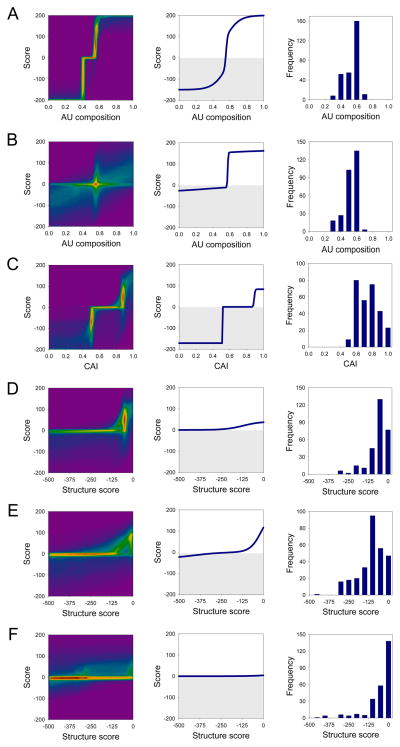
Figure 3. Parameterization of a mathematical function that calculates protein expression levels from ORF sequence.
The function is the sum of six pairs of sigmoids representing reward and penalty contributions of 5′ (A) and 3′ (B) ORF regional AU composition, the ORF codon adaptation index (C), 5′ (D), middle (E) and 3′ (F) ORF regional secondary structure content. The score of each component ranges [−200,200]; their sum is mapped onto the protein expression category as <−100→0 (no expression), [−100,0]→1 (low), [0,100]→2 (medium), >100→3 (high). Left column: density plot of the distribution of sigmoids in the ensemble of near-optimal solutions. False coloring indicates how many sigmoidal curve segments pass through a region (magenta, none < blue < green < yellow < red, high). These distributions give an indication of the uncertainty in the parameter set. For instance, although there are many solutions for the 3′ ORF regional composition (B), it is clear that all have a penalty (lower-left quadrant) and reward (upper-right quadrant) with a critical transition centered at ~56% (red peak). Middle column: sigmoids of the parameters set that best fits the data (grey area: penalty score values). Right column: distribution of parameters in the experimental dataset (note that for the C-terminal segment there are 29 alleles with secondary structure scores <−500, which are not shown).

