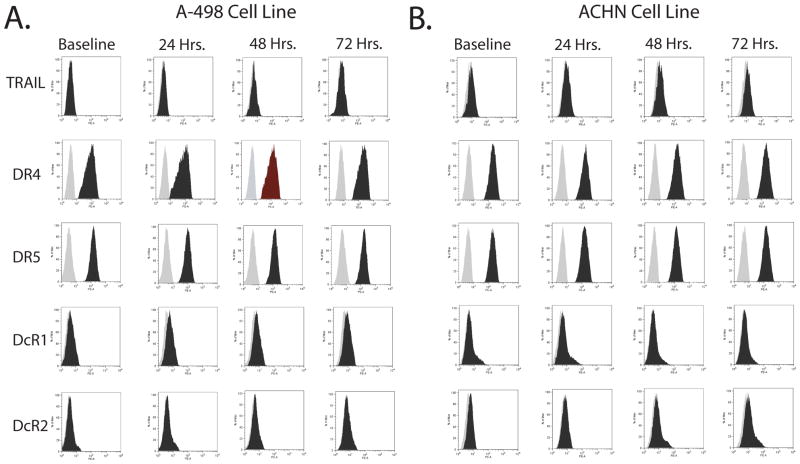
Figure 5. Synergy between TRAIL and IFNα in A-498 and ACHN RCC cells is not due to IFNα induced changes in cell surface expression of TRAIL or its cognate death receptors.
Flow cytometry data measuring surface expression of TRAIL and its cognate receptors in A-498 (A) or ACHN (B) cells treated for 0, 24, 48, and 72 hours with 1,000 IU/ml IFNα. The lighter plot represents the negative control, the darker plot the surface expression of the specific death receptor.

