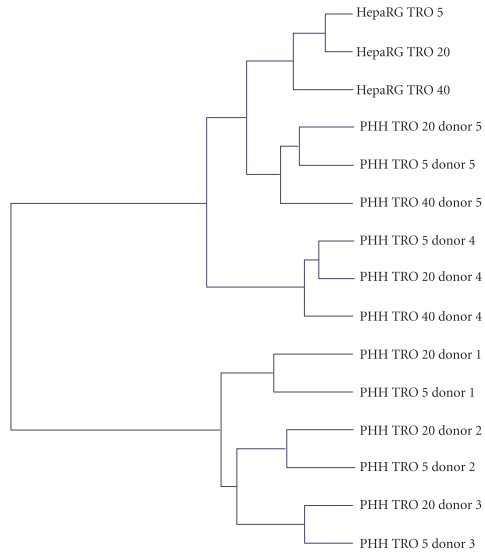
Figure 1.
Two-dimensional hierarchical clustering of gene expression profiles induced by TRO treatment in primary human hepatocytes from five donors and HepaRG cells. The clustering was generated by using the Resolver system software with an agglomerative algorithm, the Ward's min variance link heuristic criteria, and the Euclidean distance metric. Cultures and microarray analysis as in Table 2.

