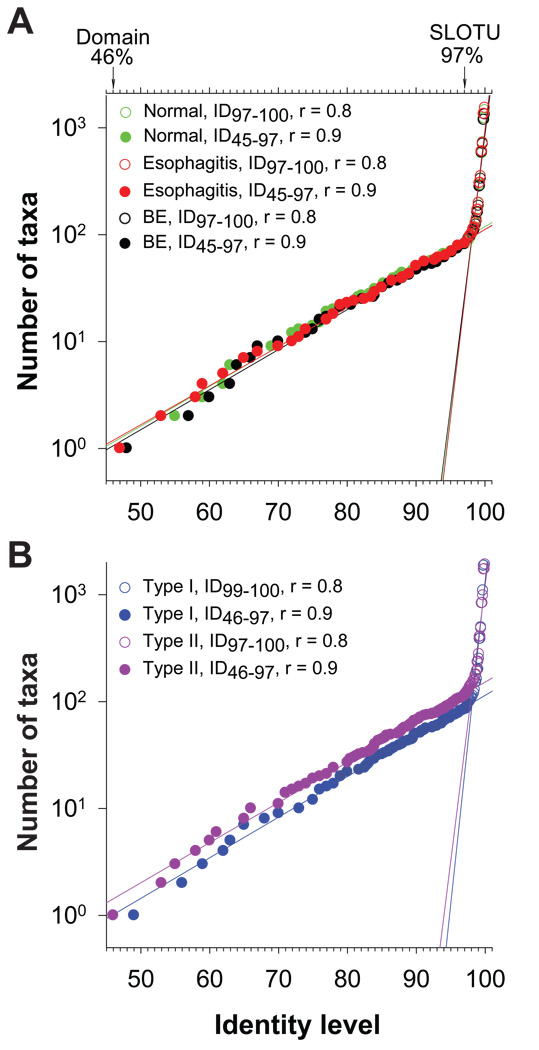
Figure 2.
Bacterial phylogenesis in the distal esophagus. (A) DNA sequences were pooled according to host phenotypes: normal, esophagitis, and Barrett’s esophagus. The number of taxa at a specific identity level (ID), every 1% between ID46 and ID80 and every 0.1% between ID80 and ID100, were calculated using DOTUR, showing changing in the number of taxa with increasing mutations over the entire hierarchy of domain Bacteria. The rates of the changes and their turning points were analyzed by linear regressions. Values from the domain level to the species level are represented by filled circles while those at the species level and below are indicated by open circles. (B) DNA sequences were pooled according to microbiome types: type I and type II using the same methods as Figure 2A.

