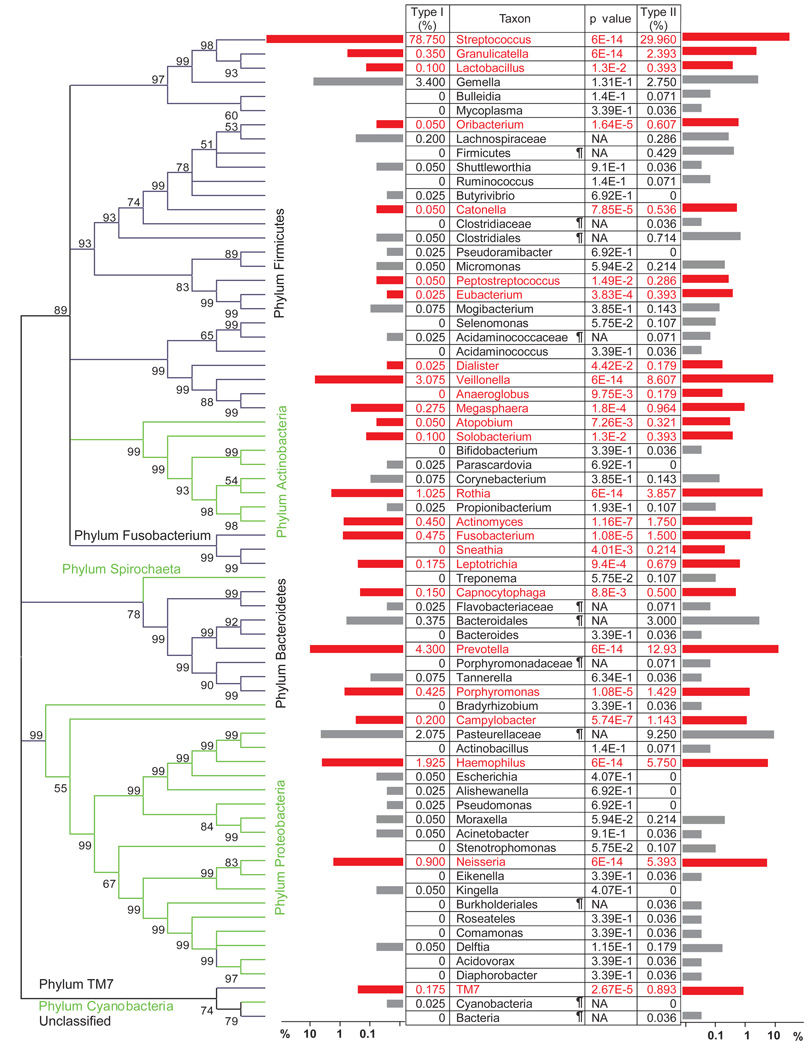
Figure 3.
Differential representation of genera between the two types of microbiome. Pooled 16S rRNA gene sequences from type I samples were compared at the genus level (or the lowest classifiable rank above genus) with those from type II samples using LIBRARY COMPARE in RDP II.25 Relative abundances of a genus in the two types are shown in the table and by the horizontal bars, with genera that are significantly different between the two types of microbiome highlighted in red. Unclassified taxa are marked with a ¶. Distribution of the genera in the taxonomic hierarchy of domain bacteria is shown in the phylogenetic tree, with alternating black and green brackets to contrast neighboring phyla. Bootstrap values were based on 500 replicates.

