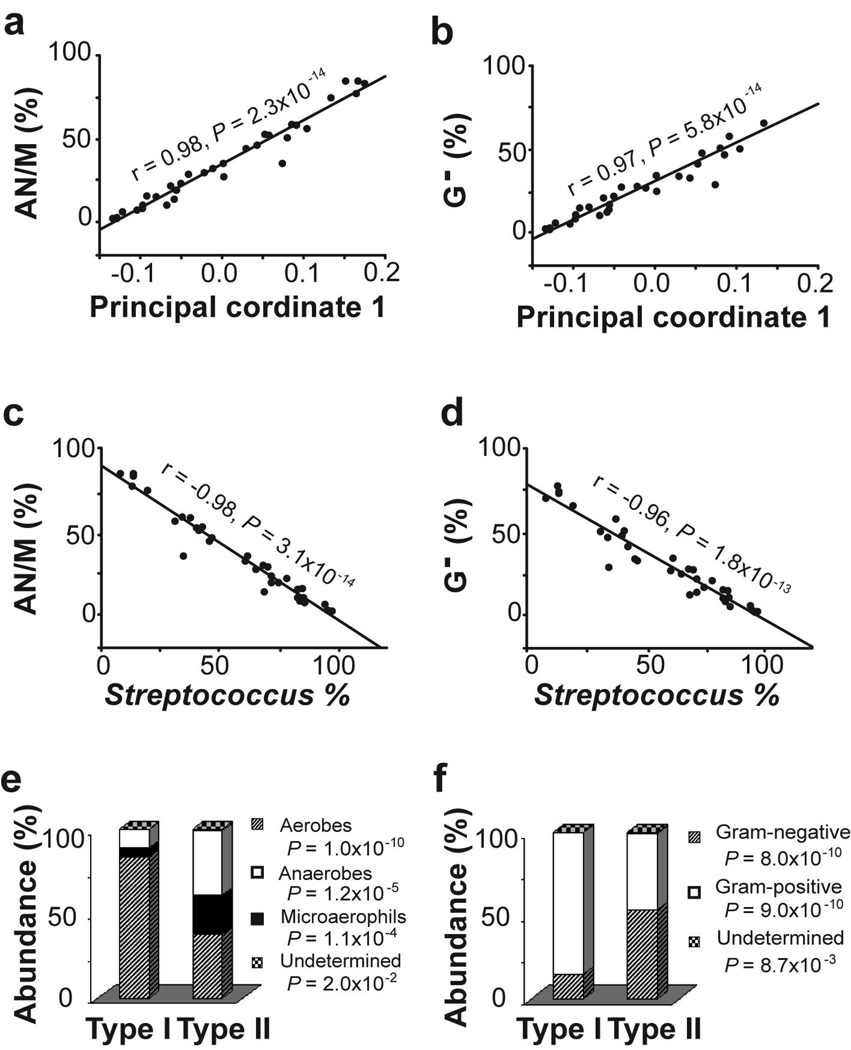
Figure 5.
Taxonomic characterization of microbiome by population of main bacterial groups. (A) Microbiome-abundance correlation analyses between the first principal coordinates (PC1) in DPCoA and the relative abundance of anaerobic/microaerophilic bacteria (AN/M). (B) Correlation between the first principal coordinates (PC1) in DPCoA and the relative abundance of Gram-negative (G-) bacteria. (C) Correlations between the relative abundance of Streptococcus and that of anaerobic/microaerophilic bacteria. (D) Correlations between the relative abundance of Streptococcus and that of Gram-negative bacteria. (F) Comparisons of microbiome types according to culture conditions. (E) Comparisons of microbiome types according and staining properties.

