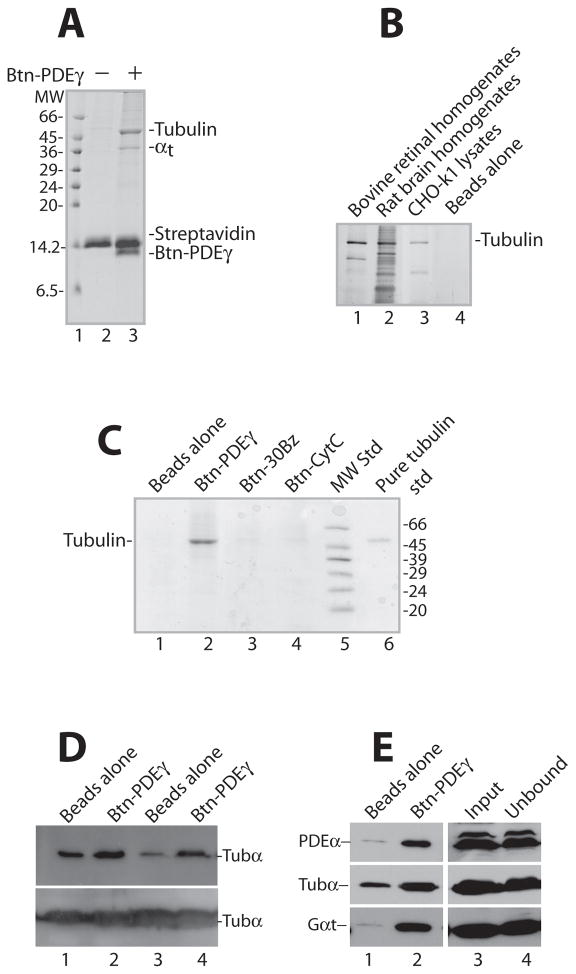
Figure 1. Specific pull down of tubulin by PDEγ from bovine retinal homogenates.
Shown are Coomassie-stained SDS gels (A, B, C) and Western blots (D, E), each is a representative of 2–4 similar experiments. In each reaction pull down from 100 μg retinal homogenates was performed using 2 μg (or otherwise stated) of Btn-PDEγ immobilized on 1 μl streptavidin beads.
A. The tubulin pull down by Btn-PDEγ from retinal homogenates appears as a prominent band of ~55 kDa (lane 3). Lane 2 is the control with no Btn-PDEγ. MW, molecular weight. B. Tubulin was pulled down by Btn-PDEγ from bovine retinal homogenates (lane 1), rat brain homogenates (lane 2), as well as CHO-k1 cell lysates (lane 3). The gel was silver-stained using the Pierce SilverSNAP Stain kit II. C. Btn-PDEγ on the streptavidin beads pulled down tubulin specifically from retinal homogenates (lane 2), as compared to the beads with no Btn-PDEγ (lane 1), the beads bound with Btn-30Bz (lane 3), and the beads bound with Btn-CytC (lane 4). D. Btn-PDEγ specifically pulled down tubulin from both bovine (see lanes 1and 2) and mouse (see lanes 3 and 4) retinal homogenates, as revealed by immunoblotting. The lower panel shows unbound tubulin in the supernatants. E. Immunoblotting of PDEα, tubulin-α (tubα), and transducin-α (Gαt) in the pull down from bovine retinal homogenates. For each reaction 6 μg of Btn-PDEγ and 2 μl of streptavidin beads were used. Lane 1 is the Btn-PDEγ minus control; lane 2 is pull down on the Btn-PDEγ beads; lane 3 is the homogenates used for each reaction; lane 4 is the unbound protein in the supernatant. Semi-quantitation of tubulin pull down relative to input (100%, lane 3): 6.7%, 34.4%, and 58.2% in lanes 1, 2, and 4, respectively.

