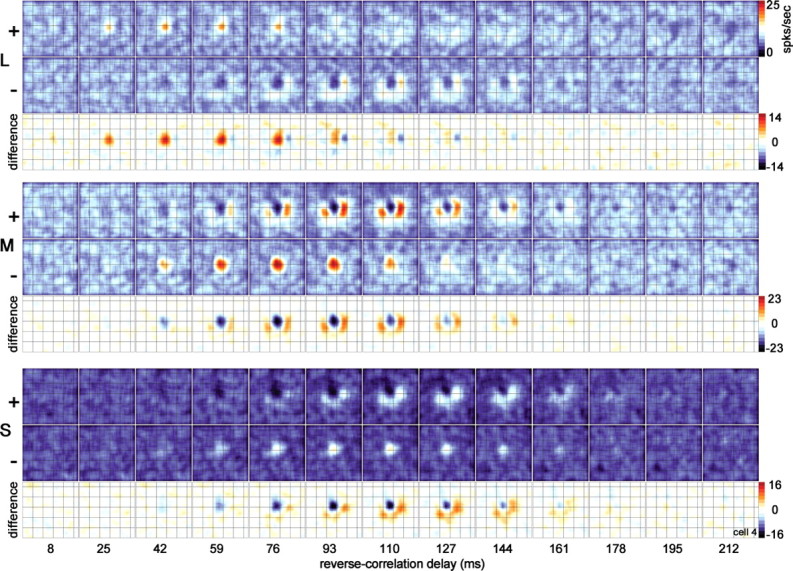
Figure 10.

Spatiotemporal response of the cone inputs to a single cone-opponent neuron. The location of the overlying grid (0.75° gridline spacing) is useful in comparing the location of the responses in different maps. The two states of the stimulus consisted of a bright state (+), which increased the activity of the given cone class, and a dark state (−), which decreased the response of the given cone class. Responses in the + and − maps are indicated by a color scale bar, in spikes per second. Black shows zero firing rate. Responses in the difference maps, constructed by subtracting the − map from the + map, are also indicated by a color scale bar (spikes per second): white shows zero difference, red shows excitation, and black shows suppression. Each single map is the average response over a 17 ms time window; each horizontal strip shows the evolution of the response over 13 windows (total of 221 ms). Maps at the earliest reverse-correlation delay (8 ms) show no structure; these maps show the average response of the neuron before the visual latency is reached and are a useful measure of the baseline firing rate of the cell under each stimulus condition. Responses to the two states of each stimulus were collected in a single stimulus run. The stimulus size was 0.64° square, and the stimulus duration was 68 ms.
