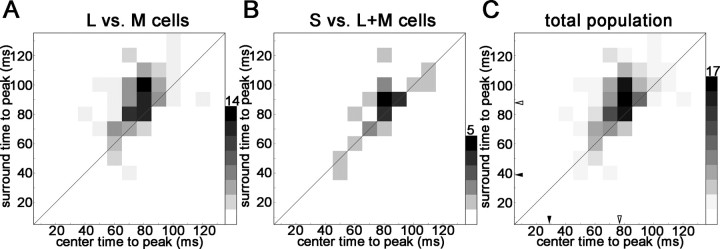
Figure 12.
Time-to-peak of the excitatory response of the receptive-field centers and surrounds of cone-opponent neurons in V1. Cell responses have been binned in 10 ms bins, according to their times-to-peak. The scale bar indicates the number of counts in each bin. A, The time-to-peak surround response of the red–green neurons was on average 12 ms later than the time-to-peak center response (t test, p < 0.0002). This is reflected as a displacement of responses above the diagonal. B, The time-to-peak surround response of the blue–yellow cells was not significantly different from the time-to-peak center response (p < 0.09). C, Time-to-peak responses for the whole population. The average delays of center and surround are indicated by open arrowheads (difference is 11 ms; p < 0.003). Average time-to-peak responses in the LGN are indicated by filled arrowheads (from Reid and Shapley, 2002). Only significant center and surround responses (>2.5 SDs of the background) were analyzed.

