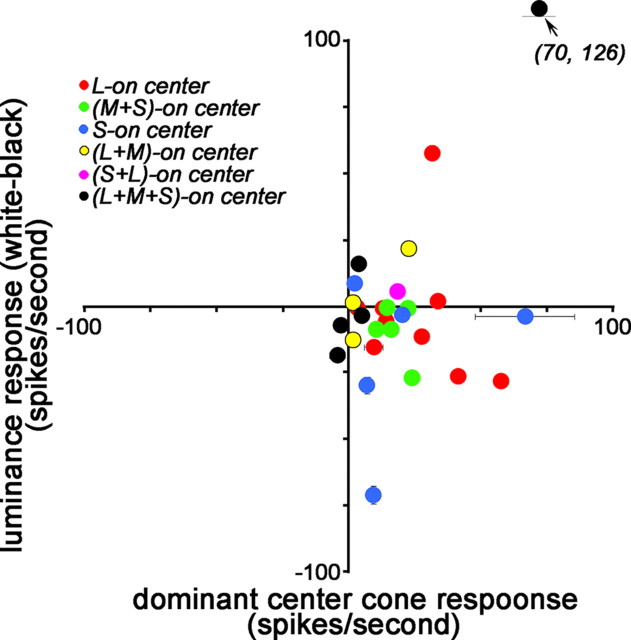
Figure 13.
Responses of cone-opponent neurons to achromatic stimuli. Peak responses (method 2; see Materials and Methods) of the dominant center cone were compared with the white–black response at the receptive-field center. For (L+M)-ON cells, the average response to L and M was used. SDs of the background firing rate are shown if larger than the symbol size. Units are spikes per second.

