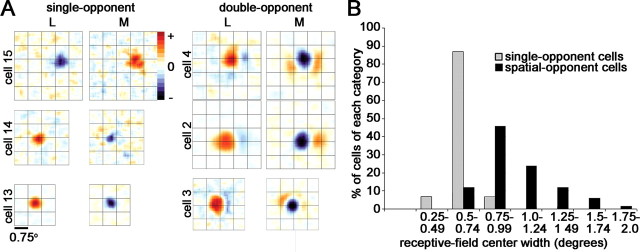
Figure 14.
Receptive fields of single-opponent neurons in V1. A, Difference response maps to L and M cone-isolating stimuli of three single-opponent cells and three double-opponent cells. Response maps were taken at the peak reverse-correlation delay. Excitation (+) is shown in red; suppression (−) is shown in blue. The complete spatiotemporal movie of cell 13 is shown in supplemental Figure 4 (available at www.jneurosci.org as supplemental material). The overlying grid is 0.75°. B, Quantification of the receptive-field sizes of the population of single-opponent neurons and the receptive-field centers of spatial-opponent neurons (¾-opponent neurons and double-opponent neurons combined). The single-opponent neurons have smaller receptive-field sizes (t test, p < 0.006).

