
Figure 15.
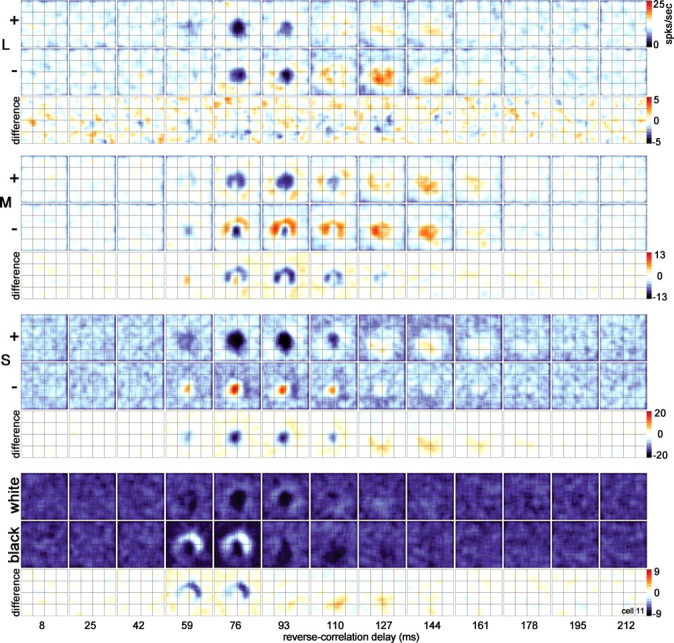
Spatiotemporal response of the cone inputs to a blue–yellow cell [(L+M)-ON-center]. The center showed pronounced suppression to S+ and weak excitation to M+ (59 ms in the difference maps). The L cone did not show push–pull structure (both + and − maps show the same response pattern). A lack of push–pull in L and/or M maps was often found in blue–yellow neurons (Fig. 3). Stimulus duration of 34 ms. Stimulus size of 0.64°. Other conventions as for Figure 10.