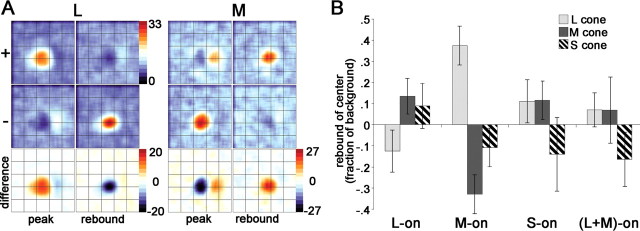
Figure 16.
Rebound responses of cone-opponent cells. A, Spatiotemporal response of the cone inputs to a red-ON-center cell that showed rebound responses in both center and surround. Stimulus duration of 51 ms. Stimulus size of 0.48°. “peak” shows maps at 76 ms reverse-correlation delay; “rebound” shows maps at 127 ms. Units are spikes per second. Other conventions as for Figure 10. The complete spatiotemporal response movie (supplemental Fig. 7, available at www.jneurosci.org as supplemental material) illustrates the interplay of the rebound response combined with the difference in timing of center and surround (Fig. 12). B, Average rebound responses to cone-isolating stimuli of the receptive-field center of L-ON-center cells, M-ON-center cells, S-ON-center cells, and (L+M)-ON-center cells. Responses are taken at the peak rebound response, after the cessation of the stimulus, and are determined by subtracting the − response from the + response, reported as a fraction of the baseline response. In neurons that showed no rebound response, the response at a reverse-correlation delay corresponding to the average time-to-rebound-peak for the population of cells was used. Red–green neurons (L-ON and M-ON) showed rebound responses: the rebound of L-ON cells involved suppression by L cones and excitation by M+S cones; the rebound of M-ON cells showed excitation by L cones and suppression by M+S cones. S-ON neurons showed rebound responses to L+M stimuli but not to S stimuli; (L+M)-ON neurons did not show rebound responses to any cone stimulus. SEMs are shown.

