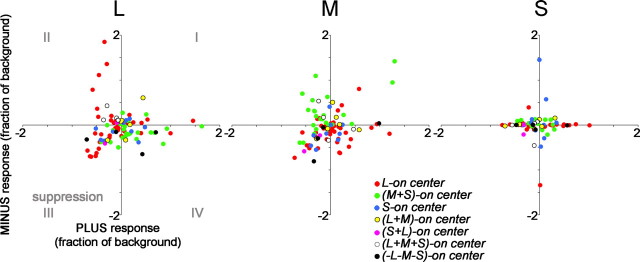
Figure 17.
Rebound responses of cone-opponent neurons to + versus − states of the cone-isolating stimuli: L, left plot; M, middle plot; S, right plot. Responses calculated using Equation 4 (see Materials and Methods). Responses in quadrants II and IV show rebound responses, as expected from Figure 16: L-ON cells in quadrant II in the L plot and in quadrant IV in the M plot; M-ON cells in quadrant IV in the L plot and in quadrant II in the M plot. These neurons are capable of temporal color contrast. Other neurons showed suppressive rebound responses to both states of a given cone-isolating stimulus, depicted in quadrant III. S-cone rebound responses were weaker, shown by the clustering of the responses around the origin.

