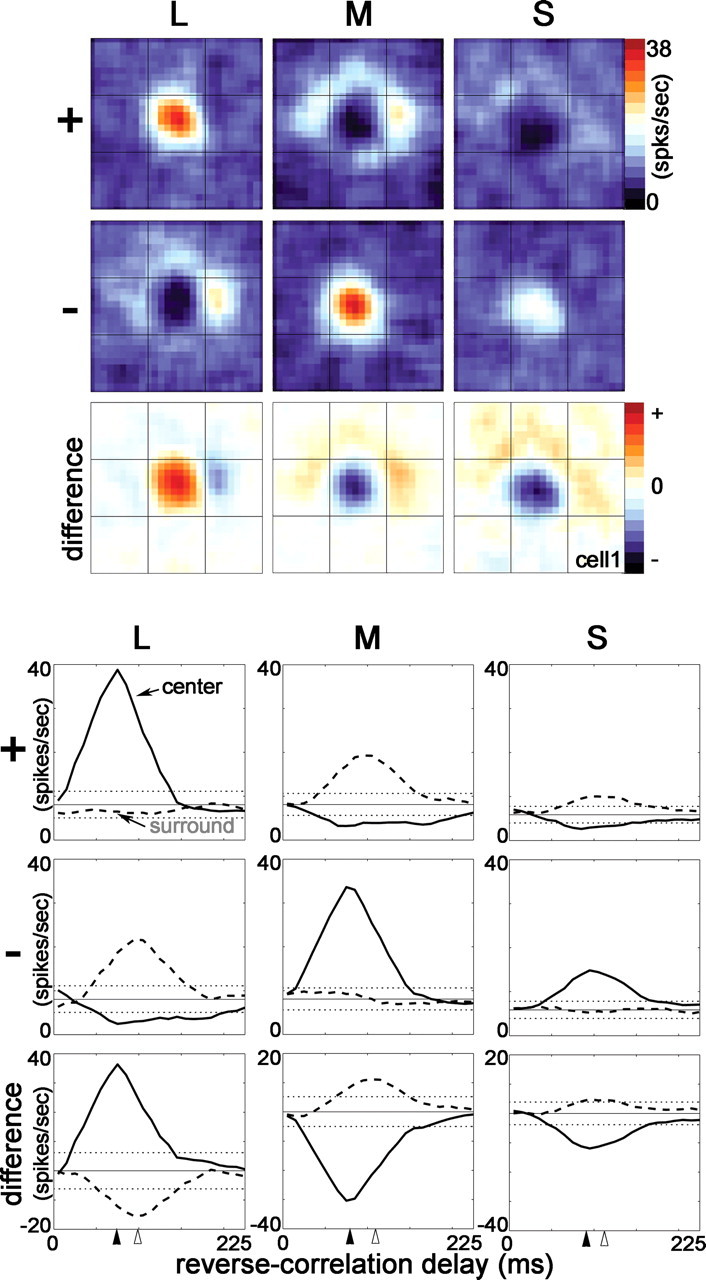
Figure 2.

Response maps (top) and the spike-triggered average histograms (bottom) to cone-isolating stimuli for a single cone-opponent neuron in primary visual cortex of an alert macaque. The response maps show the spatial structure of cone inputs to the receptive field at the optimal reverse-correlation delay of the receptive-field center (93 ms). The difference maps are the − response subtracted from the + response and show excitation in red and suppression in blue. The neuron showed both spatial and chromatic opponency, i.e., double-opponency. For this neuron, the peak center is aligned with the center of the response maps. The spike-triggered average histograms show the temporal evolution of the response of the peak center and peak surround locations (method 1 was used to index the center and surround; see Materials and Methods). Two SDs above and below the mean background firing rate are indicated by the horizontal dotted lines. Solid arrowheads show the time-to-peak of the center; open arrowheads show the time-to-peak of the surround.
