Figure 5.
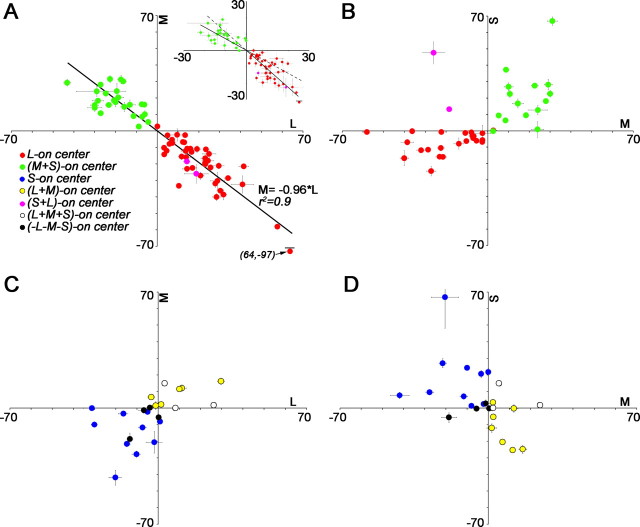
The balance of cone inputs to the receptive-field centers of cone-opponent neurons. Units are spikes per second. Error bars are SDs of the baseline firing rate of each neuron. A, M versus L input to red–green cells. The regression line combining L-ON and M-ON cells showed balance opponency of L and M (M = −0.96 × L; r2 = 0.9; measured using the peak difference method, method 2; see Materials and Methods). Area responses (method 4; Materials and Methods) revealed a subtle difference in cone ratios of the two populations, reflected as a kink about the origin when the average L versus M input to M-ON cells is plotted separately from that to L-ON cells (inset; L-ON cells, M = −1.13 × L; M-ON cells, M = −0.71 × L; regression lines are carried into the adjacent quadrant as dotted lines). This difference reflects the ON/OFF asymmetries shown in Figure 4. B, S versus M input to red–green cells. The majority of red–green neurons were driven by the S-cone stimulus, in a manner that pitted M+S against L. C, D, M versus L input (C) and S versus M input (D) to blue–yellow cells and achromatic cells.

