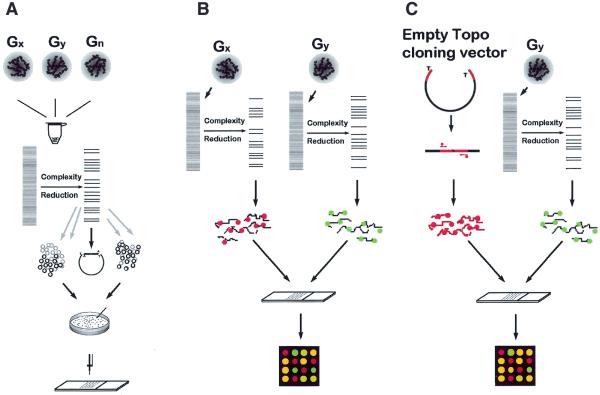
Figure 1.
Schematic representation of DArT. (A) Generation of Diversity Panels. Genomic DNAs of specimens to be studied are pooled together. The DNA is cut with a chosen restriction enzyme and ligated to adapters. The genome complexity is reduced in this case by PCR using primers with selective overhangs. The fragments from representations are cloned. Cloned inserts are amplified using vector-specific primers, purified and arrayed onto a solid support. (B) Contrasting two samples using DArT. Two genomic samples are converted to representations using the same methods as in (A). Each representation is labelled with a green or red fluorescent dye, mixed and hybridised to the Diversity Panel. The ratio of green:red signal intensity is measured at each array feature. Significant differences in the signal ratio indicate array elements (and the relevant fragment of the genome) for which the two samples differ. (C) Genetic fingerprinting using DArT. The DNA sample for analysis is converted to a representation using the methods as in (A) and labelled with green fluorescent dye. Fragments of the cloning vector, which are common to all elements of the array (polylinker of PCR2.1-TOPO vector, marked red), are labelled with red fluorescent dye and hybridised to a Diversity Panel together with green fluorescence-labelled representation. First the ratio of signal intensity is measured at each array feature for each input genotype used to generate Diversity Panels. Polymorphic spots are identified by binary distribution of signal ratios among input samples. Any new specimen can be assayed on arrays of polymorphic features to generate a genetic fingerprint.

