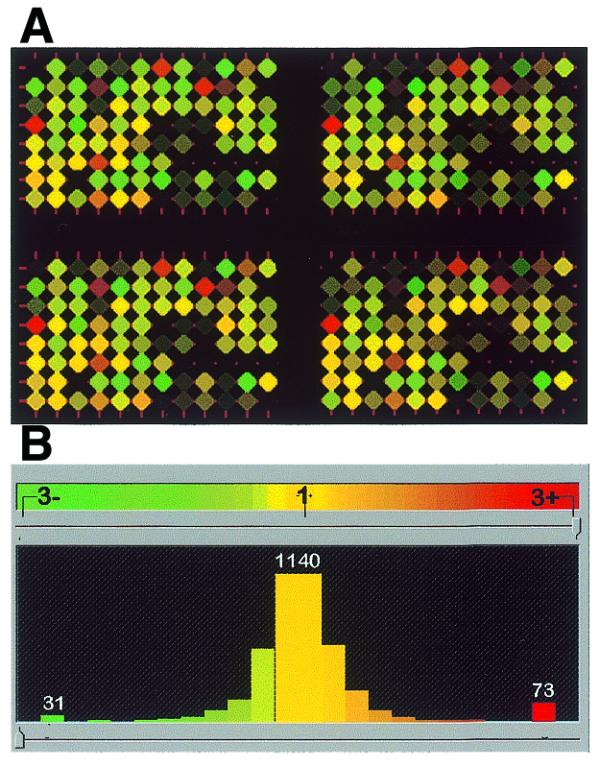
Figure 2.

Differences between two rice cultivars, IR64 and Millin, detected using EcoRI Diversity Panels and Pathways image analysis program. (A) Synthetic array image of 96 spots printed four times from the EcoRI Diversity Panel. The rice cultivars IR64 and Millin were labelled with Cy3-green and Cy5-red, respectively. Files of scanned images of the whole array are available at http://farm.cambia.org.au/Nucleic_Acids/. (B) Histogram of green:red normalised signal intensity ratios shows trimodal distribution. The majority of the array features show signal intensity ratios ~1, indicating equal hybridisation intensity for Millin and IR64. The green and red ‘tails’ seen at signal intensity ratios >2.9 indicate features of the Diversity Panel that differentiate IR64 and Millin DNA.
