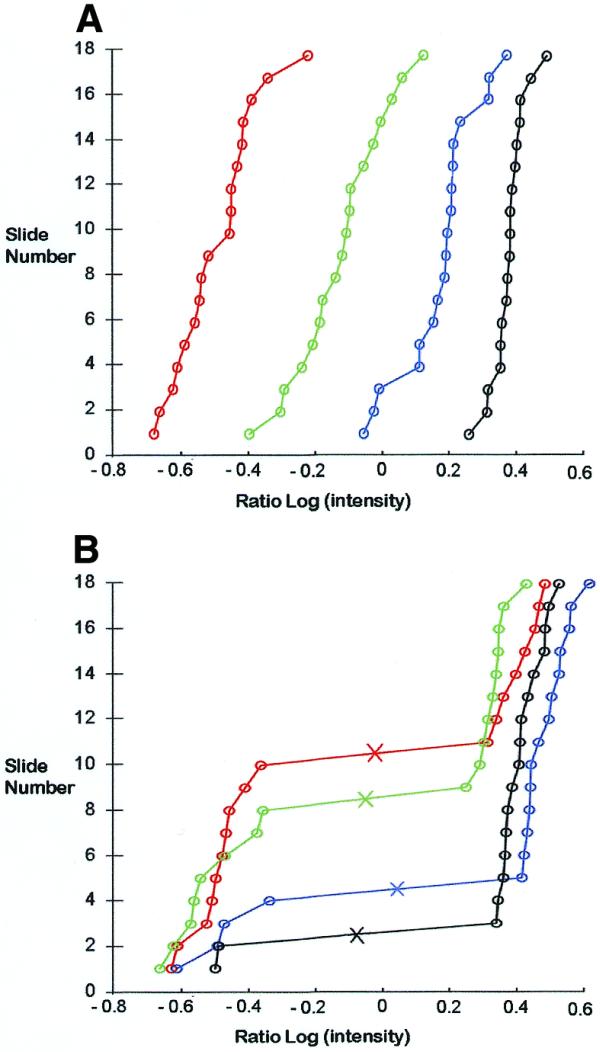
Figure 4.

Examples of green:red signal ratio distributions for spots from the MspI Diversity panel among nine rice cultivars (two replica slides per cultivar). (A) Cumulative distribution function of log-transformed normalised signal ratios for four different non-polymorphic spots across 18 different slides. Classification of the spots as non-polymorphic is based on the monomodal distribution of the ratios across all slides. (B) Cumulative distribution function of log-transformed normalised signal ratios for four different polymorphic spots across 18 different slides. Classification of the spots as polymorphic spots is based on a clear bimodal distribution across all slides. The algorithm calculates the best value for separation of the high (value of 1) and low (value of 0) clusters shown as an ‘×’ on the curves.
